McDonalds 2013 Annual Report Download - page 23
Download and view the complete annual report
Please find page 23 of the 2013 McDonalds annual report below. You can navigate through the pages in the report by either clicking on the pages listed below, or by using the keyword search tool below to find specific information within the annual report.-
 1
1 -
2
-
3
-
4
-
5
-
6
-
7
-
8
-
9
-
10
-
11
-
12
-
 13
13 -
 14
14 -
 15
15 -
 16
16 -
 17
17 -
 18
18 -
 19
19 -
 20
20 -
 21
21 -
 22
22 -
 23
23 -
 24
24 -
 25
25 -
 26
26 -
 27
27 -
 28
28 -
 29
29 -
 30
30 -
 31
31 -
 32
32 -
 33
33 -
34
-
35
-
36
-
37
-
38
-
39
-
40
-
41
-
42
-
43
-
44
-
45
-
46
-
47
-
48
-
49
-
50
-
51
-
52
-
53
-
54
-
55
-
56
-
57
-
58
-
59
-
60
-
61
-
62
-
63
-
64
 |
 |

McDonald’s Corporation 2013 Annual Report | 15
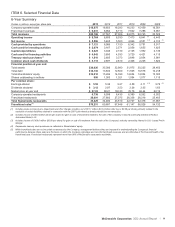
NET INCOME AND DILUTED EARNINGS PER COMMON SHARE
In 2013, net income increased 2% (3% in constant currencies) to
$5.6 billion and diluted earnings per common share increased 4%
(4% in constant currencies) to $5.55. Foreign currency translation
had a negative impact of $0.05 on diluted earnings per share. Net
income and diluted earnings per share growth in constant
currencies were positively impacted by higher franchised margin
dollars, and to a lesser extent, lower selling, general and
administrative expenses. This was partly offset by lower
Company-operated margin dollars. A decrease in diluted weighted
average shares outstanding also contributed to the diluted
earnings per share growth in 2013.
In 2012, net income decreased 1% (increased 3% in constant
currencies) to $5.5 billion and diluted earnings per common share
increased 2% (5% in constant currencies) to $5.36. Foreign
currency translation had a negative impact of $0.17 on diluted
earnings per share. Net income and diluted earnings per share
growth in constant currencies were positively impacted by growth
in franchised margin dollars, partly offset by a higher effective
income tax rate and higher selling, general and administrative
expenses. A decrease in diluted weighted average shares
outstanding also contributed to the diluted earnings per share
growth in 2012.
The Company repurchased 18.7 million shares of its stock for
$1.8 billion in 2013 and 28.1 million shares of its stock for $2.6
billion in 2012, driving reductions in weighted-average shares
outstanding on a diluted basis in both periods.
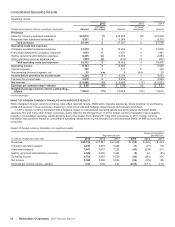
REVENUES
The Company’s revenues consist of sales by Company-operated restaurants and fees from restaurants operated by franchisees. Revenues
from conventional franchised restaurants include rent and royalties based on a percent of sales, minimum rent payments and initial fees.
Revenues from franchised restaurants that are licensed to foreign affiliates and developmental licensees include a royalty based on a
percent of sales, and generally include initial fees.
In 2013, constant currency revenue growth was due to expansion. Weak comparable sales reflected a muted response to customer-
facing initiatives amid a highly competitive and sluggish IEO segment across many markets. In 2012, constant currency revenue growth was
driven primarily by positive comparable sales as well as expansion.
Revenues
Amount Increase/(decrease)
Increase/(decrease)
excluding currency
translation
Dollars in millions 2013 2012 2011 2013 2012 2013 2012
Company-operated sales:
U.S. $ 4,512 $ 4,530 $ 4,433 0% 2% 0% 2%
Europe 8,138 7,850 7,852 4036
APMEA 5,425 5,350 5,061 1625
Other Countries & Corporate 800 873 947 (8) (8) (6) (7)
Total $18,875 $18,603 $18,293 1% 2% 1% 4%
Franchised revenues:
U.S. $ 4,339 $ 4,284 $ 4,096 1% 5% 1% 5%
Europe 3,162 2,977 3,034 6(2) 45
APMEA 1,052 1,041 958 1989
Other Countries & Corporate 678 662 625 26811
Total $ 9,231 $ 8,964 $ 8,713 3% 3% 3% 6%
Total revenues:
U.S. $ 8,851 $ 8,814 $ 8,529 0% 3% 0% 3%
Europe 11,300 10,827 10,886 4(1) 36
APMEA 6,477 6,391 6,019 1636
Other Countries & Corporate 1,478 1,535 1,572 (4) (2) 00
Total $28,106 $27,567 $27,006 2% 2% 2% 5%
In the U.S., revenues were relatively flat in 2013 as the
positive impact of expansion was offset by negative comparable
sales, reflecting initiatives that did not resonate as strongly as
expected with customers. Revenues increased in 2012 primarily
due to positive comparable sales, reflecting everyday value
offerings, menu variety and the enhanced customer experience
due to reimaging, despite broad competitive activity.
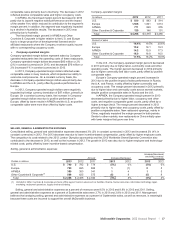
Europe's constant currency increase in revenues in 2013
benefited from expansion, primarily in Russia (which is almost
entirely Company-operated), and positive comparable sales
performance in the U.K. and Russia, the segment's two largest
Company-operated restaurant markets, partly offset by negative
results in Germany. The 2012 increase was primarily driven by
positive comparable sales in the U.K. and Russia, as well as
expansion in Russia.
In APMEA, the constant currency increase in revenues in
2013 was driven by expansion in China and other markets, partly
offset by negative comparable sales, primarily in China (which is
mostly Company-operated). The constant currency increase in
revenues in 2012 was primarily driven by positive comparable
sales in China, Australia and many other markets, as well as
expansion, primarily in China.