McDonalds 2013 Annual Report Download - page 27
Download and view the complete annual report
Please find page 27 of the 2013 McDonalds annual report below. You can navigate through the pages in the report by either clicking on the pages listed below, or by using the keyword search tool below to find specific information within the annual report.-
 1
1 -
2
-
3
-
4
-
5
-
6
-
7
-
8
-
9
-
10
-
11
-
12
-
13
-
14
-
15
-
16
-
 17
17 -
 18
18 -
 19
19 -
 20
20 -
 21
21 -
 22
22 -
 23
23 -
 24
24 -
 25
25 -
 26
26 -
 27
27 -
 28
28 -
 29
29 -
 30
30 -
 31
31 -
 32
32 -
 33
33 -
 34
34 -
 35
35 -
 36
36 -
 37
37 -
38
-
39
-
40
-
41
-
42
-
43
-
44
-
45
-
46
-
47
-
48
-
49
-
50
-
51
-
52
-
53
-
54
-
55
-
56
-
57
-
58
-
59
-
60
-
61
-
62
-
63
-
64
 |
 |

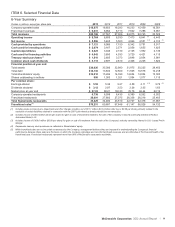
McDonald’s Corporation 2013 Annual Report | 19
INTEREST EXPENSE
Interest expense increased 1% and 5% in 2013 and 2012,
respectively, primarily due to higher average debt balances, partly
offset by lower average interest rates.
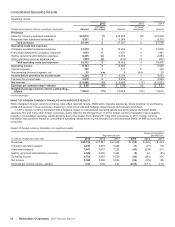
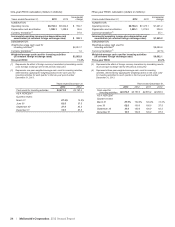
NONOPERATING (INCOME) EXPENSE, NET
Nonoperating (income) expense, net
In millions 2013 2012 2011
Interest income $(15) $ (28) $(39)
Foreign currency and hedging activity 89 9
Other expense 45 28 55
Total $ 38 $ 9 $ 25
Interest income consists primarily of interest earned on short-term
cash investments. Foreign currency and hedging activity includes
net gains or losses on certain hedges that reduce the exposure to
variability on certain intercompany foreign currency cash flow
streams.
PROVISION FOR INCOME TAXES
In 2013, 2012 and 2011, the reported effective income tax rates
were 31.9%, 32.4% and 31.3%, respectively.
In 2013, the effective income tax rate included a tax benefit of
nearly $50 million, reflecting the retroactive impact of certain tax
benefits as a result of the American Taxpayer Relief Act of 2012.
In 2012, the effective income tax rate reflected the negative
impact of certain tax benefits in the U.S. that had expired at
December 31, 2011 and were reinstated retroactively in 2013 as
noted above.
Consolidated net deferred tax liabilities included tax assets,
net of valuation allowance, of $1.5 billion in 2013 and 2012.
Substantially all of the net tax assets are expected to be realized
in the U.S. and other profitable markets.
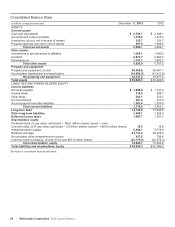
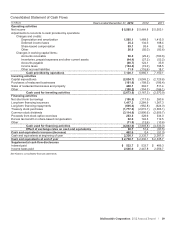
Cash Flows
The Company generates significant cash from its operations and
has substantial credit availability and capacity to fund operating
and discretionary spending such as capital expenditures, debt
repayments, dividends and share repurchases.
Cash provided by operations totaled $7.1 billion and
exceeded capital expenditures by $4.3 billion in 2013, while cash
provided by operations totaled $7.0 billion and exceeded capital
expenditures by $3.9 billion in 2012. In 2013, cash provided by
operations increased $155 million or 2% compared with 2012
primarily due to increased operating results. In 2012, cash
provided by operations decreased $184 million or 3% compared
with 2011 despite increased operating results, primarily due to
higher income tax payments and the negative impact of foreign
currency translation on operating results.
Cash used for investing activities totaled $2.7 billion in 2013,
a decrease of $493 million compared with 2012. The decrease
primarily reflected lower capital expenditures and a decrease in
other investing activities related to short-term time deposits. Cash
used for investing activities totaled $3.2 billion in 2012, an
increase of $596 million compared with 2011. The increase
primarily reflected higher capital expenditures, an increase in other
investing activities related to short-term time deposits, and lower
proceeds from sales of restaurant businesses.
Cash used for financing activities totaled $4.0 billion in 2013,
an increase of $193 million compared with 2012, primarily due to
lower net debt issuances and higher dividend payments, partly
offset by lower treasury stock purchases. Cash used for financing
activities totaled $3.8 billion in 2012, a decrease of $683 million
compared with 2011, primarily due to lower treasury stock
purchases and higher net debt issuances, partly offset by higher
dividend payments.
The Company’s cash and equivalents balance was $2.8
billion and $2.3 billion at year end 2013 and 2012, respectively.
The Company made a debt repayment of $535 million in January
2014. In addition to cash and equivalents on hand and cash
provided by operations, the Company can meet short-term funding
needs through its continued access to commercial paper
borrowings and line of credit agreements.
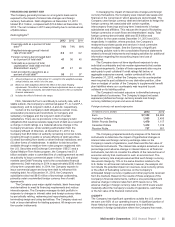
RESTAURANT DEVELOPMENT AND CAPITAL EXPENDITURES
In 2013, the Company opened 1,393 traditional restaurants and 45
satellite restaurants (small, limited-menu restaurants for which the
land and building are generally leased), and closed 295 traditional
restaurants and 194 satellite restaurants. In 2012, the Company
opened 1,404 traditional restaurants and 35 satellite restaurants
and closed 269 traditional restaurants and 200 satellite
restaurants. The majority of restaurant openings and closings
occurred in the major markets in both years. The Company closes
restaurants for a variety of reasons, such as existing sales and
profit performance or loss of real estate tenure.
Systemwide restaurants at year end(1)
2013 2012 2011
U.S. 14,278 14,157 14,098
Europe 7,602 7,368 7,156
APMEA 9,918 9,454 8,865
Other Countries & Corporate 3,631 3,501 3,391
Total 35,429 34,480 33,510
(1) Includes satellite units at December 31, 2013, 2012 and 2011, as follows:
U.S.—973, 997, 1,084; Europe—261, 246, 240; APMEA (primarily Japan)
—733, 871, 949; Other Countries & Corporate—451, 453, 459.
Approximately 70% of Company-operated restaurants and
75% of franchised restaurants were located in the major markets
at the end of 2013. Over 80% of the restaurants at year-end 2013
were franchised.