McDonalds 2013 Annual Report Download - page 35
Download and view the complete annual report
Please find page 35 of the 2013 McDonalds annual report below. You can navigate through the pages in the report by either clicking on the pages listed below, or by using the keyword search tool below to find specific information within the annual report.-
 1
1 -
2
-
3
-
4
-
5
-
6
-
7
-
8
-
9
-
10
-
11
-
12
-
13
-
14
-
15
-
16
-
17
-
18
-
19
-
20
-
21
-
22
-
23
-
24
-
 25
25 -
 26
26 -
 27
27 -
 28
28 -
 29
29 -
 30
30 -
 31
31 -
 32
32 -
 33
33 -
 34
34 -
 35
35 -
 36
36 -
 37
37 -
 38
38 -
 39
39 -
 40
40 -
 41
41 -
 42
42 -
 43
43 -
 44
44 -
 45
45 -
46
-
47
-
48
-
49
-
50
-
51
-
52
-
53
-
54
-
55
-
56
-
57
-
58
-
59
-
60
-
61
-
62
-
63
-
64
 |
 |

McDonald’s Corporation 2013 Annual Report | 27
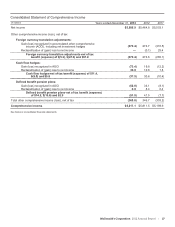
Consolidated Statement of Comprehensive Income
In millions Years ended December 31, 2013 2012 2011
Net income $5,585.9 $5,464.8 $5,503.1
Other comprehensive income (loss), net of tax
Foreign currency translation adjustments:
Gain (loss) recognized in accumulated other comprehensive
income (AOCI), including net investment hedges (279.4) 274.7 (310.5)
Reclassification of (gain) loss to net income —(0.1) 25.4
Foreign currency translation adjustments-net of tax
benefit (expense) of $(5.3), $(47.9) and $61.0 (279.4) 274.6 (285.1)
Cash flow hedges:
Gain (loss) recognized in AOCI (73.4) 19.8 (12.2)
Reclassification of (gain) loss to net income 35.9 10.8 1.8
Cash flow hedges-net of tax benefit (expense) of $11.4,
$(8.8) and $5.8 (37.5) 30.6 (10.4)
Defined benefit pension plans:
Gain (loss) recognized in AOCI (52.8) 33.1 (8.1)
Reclassification of (gain) loss to net income 0.9 8.4 0.4
Defined benefit pension plans-net of tax benefit (expense)
of $14.2, $(16.6) and $2.9 (51.9) 41.5 (7.7)
Total other comprehensive income (loss), net of tax (368.8) 346.7 (303.2)
Comprehensive income $5,217.1 $5,811.5 $5,199.9
See Notes to consolidated financial statements.