McDonalds 2013 Annual Report Download - page 32
Download and view the complete annual report
Please find page 32 of the 2013 McDonalds annual report below. You can navigate through the pages in the report by either clicking on the pages listed below, or by using the keyword search tool below to find specific information within the annual report.-
 1
1 -
2
-
3
-
4
-
5
-
6
-
7
-
8
-
9
-
10
-
11
-
12
-
13
-
14
-
15
-
16
-
17
-
18
-
19
-
20
-
21
-
 22
22 -
 23
23 -
 24
24 -
 25
25 -
 26
26 -
 27
27 -
 28
28 -
 29
29 -
 30
30 -
 31
31 -
 32
32 -
 33
33 -
 34
34 -
 35
35 -
 36
36 -
 37
37 -
 38
38 -
 39
39 -
 40
40 -
 41
41 -
 42
42 -
43
-
44
-
45
-
46
-
47
-
48
-
49
-
50
-
51
-
52
-
53
-
54
-
55
-
56
-
57
-
58
-
59
-
60
-
61
-
62
-
63
-
64
 |
 |

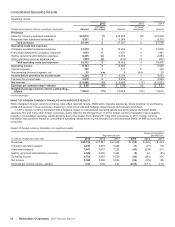
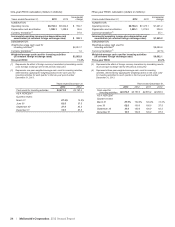
24 | McDonald’s Corporation 2013 Annual Report
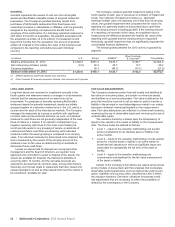
One-year ROIIC calculation (dollars in millions):
Years ended December 31, 2013 2012 Incremental
change
NUMERATOR:
Operating income $8,764.3 $8,604.6 $ 159.7
Depreciation and amortization 1,585.1 1,488.5 96.6
Currency translation(1) 81.8
Incremental operating income plus depreciation and
amortization (at constant foreign exchange rates) $338.1
DENOMINATOR:
Weighted-average cash used for
investing activities(2) $2,951.7
Currency translation(1) 1.2
Weighted-average cash used for investing activities
(at constant foreign exchange rates) $2,952.9
One-year ROIIC 11.4%
(1) Represents the effect of foreign currency translation by translating results
at an average exchange rate for the periods measured.
(2) Represents one-year weighted-average cash used for investing activities,
determined by applying the weightings below to the cash used for
investing activities for each quarter in the two-year period ended
December 31, 2013.
Years ended December 31,
2013 2012
Cash used for investing activities $2,673.8 $3,167.3
AS A PERCENT
Quarters ended:
March 31 87.5% 12.5%
June 30 62.5 37.5
September 30 37.5 62.5
December 31 12.5 87.5
Three-year ROIIC calculation (dollars in millions):
Years ended December 31, 2013 2010 Incremental
change
NUMERATOR:
Operating income $8,764.3 $7,473.1 $1,291.2
Depreciation and amortization 1,585.1 1,276.2 308.9
Currency translation(3) 25.1
Incremental operating income plus depreciation and
amortization (at constant foreign exchange rates) $1,625.2
DENOMINATOR:
Weighted-average cash used for
investing activities(4) $8,089.6
Currency translation(3) (27.5)
Weighted-average cash used for investing activities
(at constant foreign exchange rates) $8,062.1
Three-year ROIIC 20.2%
(3) Represents the effect of foreign currency translation by translating results
at an average exchange rate for the periods measured.
(4) Represents three-year weighted-average cash used for investing
activities, determined by applying the weightings below to the cash used
for investing activities for each quarter in the four-year period ended
December 31, 2013.
Years ended December 31,
2013 2012 2011 2010
Cash used for
investing activities $2,673.8 $3,167.3 $2,570.9 $2,056.0
AS A PERCENT
Quarters ended:
March 31 87.5% 100.0% 100.0% 12.5%
June 30 62.5 100.0 100.0 37.5
September 30 37.5 100.0 100.0 62.5
December 31 12.5 100.0 100.0 87.5