McDonalds 2013 Annual Report Download - page 25
Download and view the complete annual report
Please find page 25 of the 2013 McDonalds annual report below. You can navigate through the pages in the report by either clicking on the pages listed below, or by using the keyword search tool below to find specific information within the annual report.-
 1
1 -
2
-
3
-
4
-
5
-
6
-
7
-
8
-
9
-
10
-
11
-
12
-
13
-
14
-
 15
15 -
 16
16 -
 17
17 -
 18
18 -
 19
19 -
 20
20 -
 21
21 -
 22
22 -
 23
23 -
 24
24 -
 25
25 -
 26
26 -
 27
27 -
 28
28 -
 29
29 -
 30
30 -
 31
31 -
 32
32 -
 33
33 -
 34
34 -
 35
35 -
36
-
37
-
38
-
39
-
40
-
41
-
42
-
43
-
44
-
45
-
46
-
47
-
48
-
49
-
50
-
51
-
52
-
53
-
54
-
55
-
56
-
57
-
58
-
59
-
60
-
61
-
62
-
63
-
64
 |
 |

McDonald’s Corporation 2013 Annual Report | 17
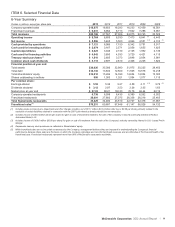
comparable sales primarily due to Germany. The decrease in 2012
reflected positive comparable sales and higher occupancy costs.
In APMEA, the franchised margin percent decreased in 2013
partly due to Japan's negative sales performance and the impact
of the weaker Yen, which reduced its contribution to the segment's
margin percent. In addition, the segment was negatively impacted
by a decline in Australia's results. The decrease in 2012 was
primarily due to Australia.
The franchised margin percent in APMEA and Other
Countries & Corporate is higher relative to the U.S. and Europe
due to a larger proportion of developmental licensed and/or
affiliated restaurants where the Company receives royalty income
with no corresponding occupancy costs.
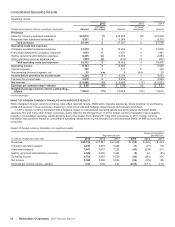
Company-operated margins
Company-operated margin dollars represent sales by Company-
operated restaurants less the operating costs of these restaurants.
Company-operated margin dollars decreased $83 million or 2%
(2% in constant currencies) in 2013, and decreased $76 million or
2% (increased 1% in constant currencies) in 2012.
In 2013, Company-operated margin dollars reflected weak
comparable sales in many markets, which impacted our ability to
overcome cost pressures. On a constant currency basis, the
decrease in Company-operated margin dollars was primarily due
to APMEA and the U.S., partly offset by positive performance in
Europe.
In 2012, Company-operated margin dollars were negatively
impacted by foreign currency translation of $97 million, primarily in
Europe. On a constant currency basis, the increase in Company-
operated margin dollars was due to positive performance in
Europe, offset by lower results in APMEA and the U.S. as positive
comparable sales were more than offset by higher costs.
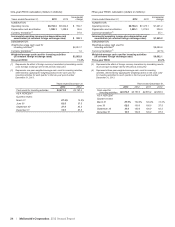
Company-operated margins
In millions 2013 2012 2011
U.S. $ 830 $ 883 $ 914
Europe 1,566 1,501 1,514
APMEA 771 849 876
Other Countries & Corporate 129 146 151
Total $ 3,296 $ 3,379 $ 3,455
Percent of sales
U.S. 18.4% 19.5% 20.6%
Europe 19.2 19.1 19.3
APMEA 14.2 15.9 17.3
Other Countries & Corporate 16.0 16.8 16.0
Total 17.5% 18.2% 18.9%
In the U.S., the Company-operated margin percent decreased
in 2013 primarily due to higher labor, commodity costs and other
operating costs. The margin percent decreased in 2012 primarily
due to higher commodity and labor costs, partly offset by positive
comparable sales.
Europe’s Company-operated margin percent increased in
2013 due to the positive impact of sales performance in Russia,
the U.K. and France, mostly offset by higher commodity and
occupancy costs. The margin percent decreased in 2012 primarily
due to higher labor and commodity costs across several markets,
despite positive comparable sales in Russia and the U.K.
In APMEA, the Company-operated margin percent in 2013
decreased primarily due to higher labor, occupancy and other
costs, and negative comparable guest counts, partly offset by a
higher average check. The margin percent decreased in 2012
primarily due to higher labor and occupancy costs, partly offset by
positive comparable sales. New restaurant openings, mainly in
China, negatively impacted the margin percent in both periods.
Similar to other markets, new restaurants in China initially open
with lower margins that grow over time.
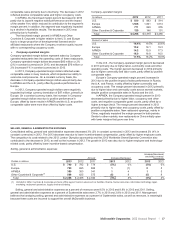
SELLING, GENERAL & ADMINISTRATIVE EXPENSES
Consolidated selling, general and administrative expenses decreased 3% (3% in constant currencies) in 2013 and increased 3% (4% in
constant currencies) in 2012. The 2013 decrease was due to lower incentive-based compensation, partly offset by higher employee costs.
The comparison to costs related to the 2012 London Olympics sponsorship and the 2012 Worldwide Owner/Operator Convention also
contributed to the decrease in 2013, as well as the increase in 2012. The growth in 2012 was also due to higher employee and technology-
related costs, partly offset by lower incentive-based compensation.
Selling, general & administrative expenses
Amount Increase/(decrease)
Increase/(decrease)
excluding currency
translation
Dollars in millions 2013 2012 2011 2013 2012 2013 2012
U.S. $ 740 $ 782 $ 779 (5%) 0% (5%) 0%
Europe 703 695 699 1(1) 05
APMEA 355 353 341 1413
Other Countries & Corporate(1) 588 625 575 (6) 9(6) 9
Total $ 2,386 $ 2,455 $ 2,394 (3%) 3% (3%) 4%
(1) Included in Other Countries & Corporate are home office support costs in areas such as facilities, finance, human resources, information technology, legal,
marketing, restaurant operations, supply chain and training.
Selling, general and administrative expenses as a percent of revenues were 8.5% in 2013 and 8.9% in 2012 and 2011. Selling,
general and administrative expenses as a percent of Systemwide sales were 2.7% in 2013 and 2.8% in 2012 and 2011. Management
believes that analyzing selling, general and administrative expenses as a percent of Systemwide sales, as well as revenues, is meaningful
because these costs are incurred to support the overall McDonald's business.