McDonalds 2013 Annual Report Download - page 24
Download and view the complete annual report
Please find page 24 of the 2013 McDonalds annual report below. You can navigate through the pages in the report by either clicking on the pages listed below, or by using the keyword search tool below to find specific information within the annual report.-
 1
1 -
2
-
3
-
4
-
5
-
6
-
7
-
8
-
9
-
10
-
11
-
12
-
13
-
 14
14 -
 15
15 -
 16
16 -
 17
17 -
 18
18 -
 19
19 -
 20
20 -
 21
21 -
 22
22 -
 23
23 -
 24
24 -
 25
25 -
 26
26 -
 27
27 -
 28
28 -
 29
29 -
 30
30 -
 31
31 -
 32
32 -
 33
33 -
 34
34 -
35
-
36
-
37
-
38
-
39
-
40
-
41
-
42
-
43
-
44
-
45
-
46
-
47
-
48
-
49
-
50
-
51
-
52
-
53
-
54
-
55
-
56
-
57
-
58
-
59
-
60
-
61
-
62
-
63
-
64
 |
 |

16 | McDonald’s Corporation 2013 Annual Report
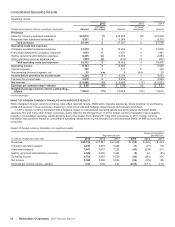
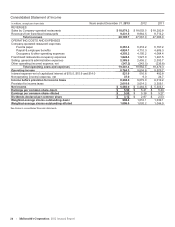
The following tables present comparable sales, comparable guest counts and Systemwide sales increases/(decreases):
Comparable sales and guest count increases/(decreases)
2013 2012 2011
Sales Guest
Counts Sales Guest
Counts Sales Guest
Counts
U.S. (0.2%) (1.6%) 3.3% 1.9% 4.8% 3.3%
Europe 0.0 (1.5) 2.4 (0.5) 5.9 3.4
APMEA (1.9) (3.8) 1.4 2.2 4.7 4.3
Other Countries & Corporate 7.0 0.4 7.7 3.0 10.1 4.5
Total 0.2% (1.9%) 3.1% 1.6% 5.6% 3.7%
In 2013, comparable guest count performance declined 1.9%. Germany was the main contributor to the decline in Europe and Japan
accounted for half of the decline in APMEA.
Systemwide sales increases/(decreases)
Excluding currency
translation
2013 2012 2013 2012
U.S. 1% 4% 1% 4%
Europe 5(2) 35
APMEA (5) 536
Other Countries & Corporate 3410 10
Total 1% 3% 3% 5%
Franchised sales are not recorded as revenues by the Company, but are the basis on which the Company calculates and records
franchised revenues and are indicative of the financial health of the franchisee base. The following table presents franchised sales and the
related increases/(decreases):
Franchised sales
Amount Increase/(decrease)
Increase excluding
currency translation
Dollars in millions 2013 2012 2011 2013 2012 2013 2012
U.S. $31,344 $31,063 $29,739 1% 4% 1% 4%
Europe 17,737 16,857 17,243 5(2) 35
APMEA 12,759 13,723 13,041 (7) 546
Other Countries & Corporate 8,411 8,044 7,625 5512 12
Total $70,251 $69,687 $67,648 1% 3% 3% 6%
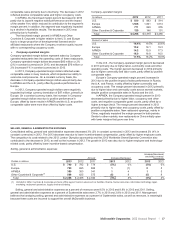
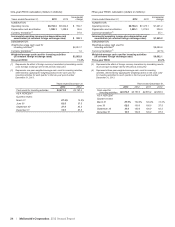
RESTAURANT MARGINS
Franchised margins
Franchised margin dollars represent revenues from franchised
restaurants less the Company’s occupancy costs (rent and
depreciation) associated with those sites. Franchised margin
dollars represented about two-thirds of the combined restaurant
margins in 2013, 2012 and 2011. Franchised margin dollars
increased $170 million or 2% (3% in constant currencies) in 2013
primarily due to expansion and increased $205 million or 3% (6%
in constant currencies) in 2012 primarily driven by positive
comparable sales.
Franchised margins
In millions 2013 2012 2011
U.S. $ 3,626 $ 3,594 $ 3,436
Europe 2,475 2,352 2,400
APMEA 923 924 858
Other Countries & Corporate 583 567 538
Total $ 7,607 $ 7,437 $ 7,232
Percent of revenues
U.S. 83.6% 83.9% 83.9%
Europe 78.3 79.0 79.1
APMEA 87.7 88.8 89.5
Other Countries & Corporate 86.0 85.6 86.1
Total 82.4% 83.0% 83.0%
In the U.S., the franchised margin percent decreased in 2013
due to higher depreciation related to reimaging and weak
comparable sales. The franchised margin percent was flat in 2012
as positive comparable sales performance was offset by higher
depreciation related to reimaging.
In Europe, the franchised margin percent decreased in 2013
due to higher rent expense in many markets and weak