Safeway 2006 Annual Report Download - page 2
Download and view the complete annual report
Please find page 2 of the 2006 Safeway annual report below. You can navigate through the pages in the report by either clicking on the pages listed below, or by using the keyword search tool below to find specific information within the annual report.-
 1
1 -
 2
2 -
 3
3 -
 4
4 -
 5
5 -
 6
6 -
 7
7 -
 8
8 -
 9
9 -
 10
10 -
 11
11 -
 12
12 -
 13
13 -
14
-
15
-
16
-
17
-
18
-
19
-
20
-
21
-
22
-
23
-
24
-
25
-
26
-
27
-
28
-
29
-
30
-
31
-
32
-
33
-
34
-
35
-
36
-
37
-
38
-
39
-
40
-
41
-
42
-
43
-
44
-
45
-
46
-
47
-
48
-
49
-
50
-
51
-
52
-
53
-
54
-
55
-
56
-
57
-
58
-
59
-
60
-
61
-
62
-
63
-
64
-
65
-
66
-
67
-
68
-
69
-
70
-
71
-
72
-
73
-
74
-
75
-
76
-
77
-
78
-
79
-
80
-
81
-
82
-
83
-
84
-
85
-
86
-
87
-
88
-
89
-
90
-
91
-
92
-
93
 |
 |
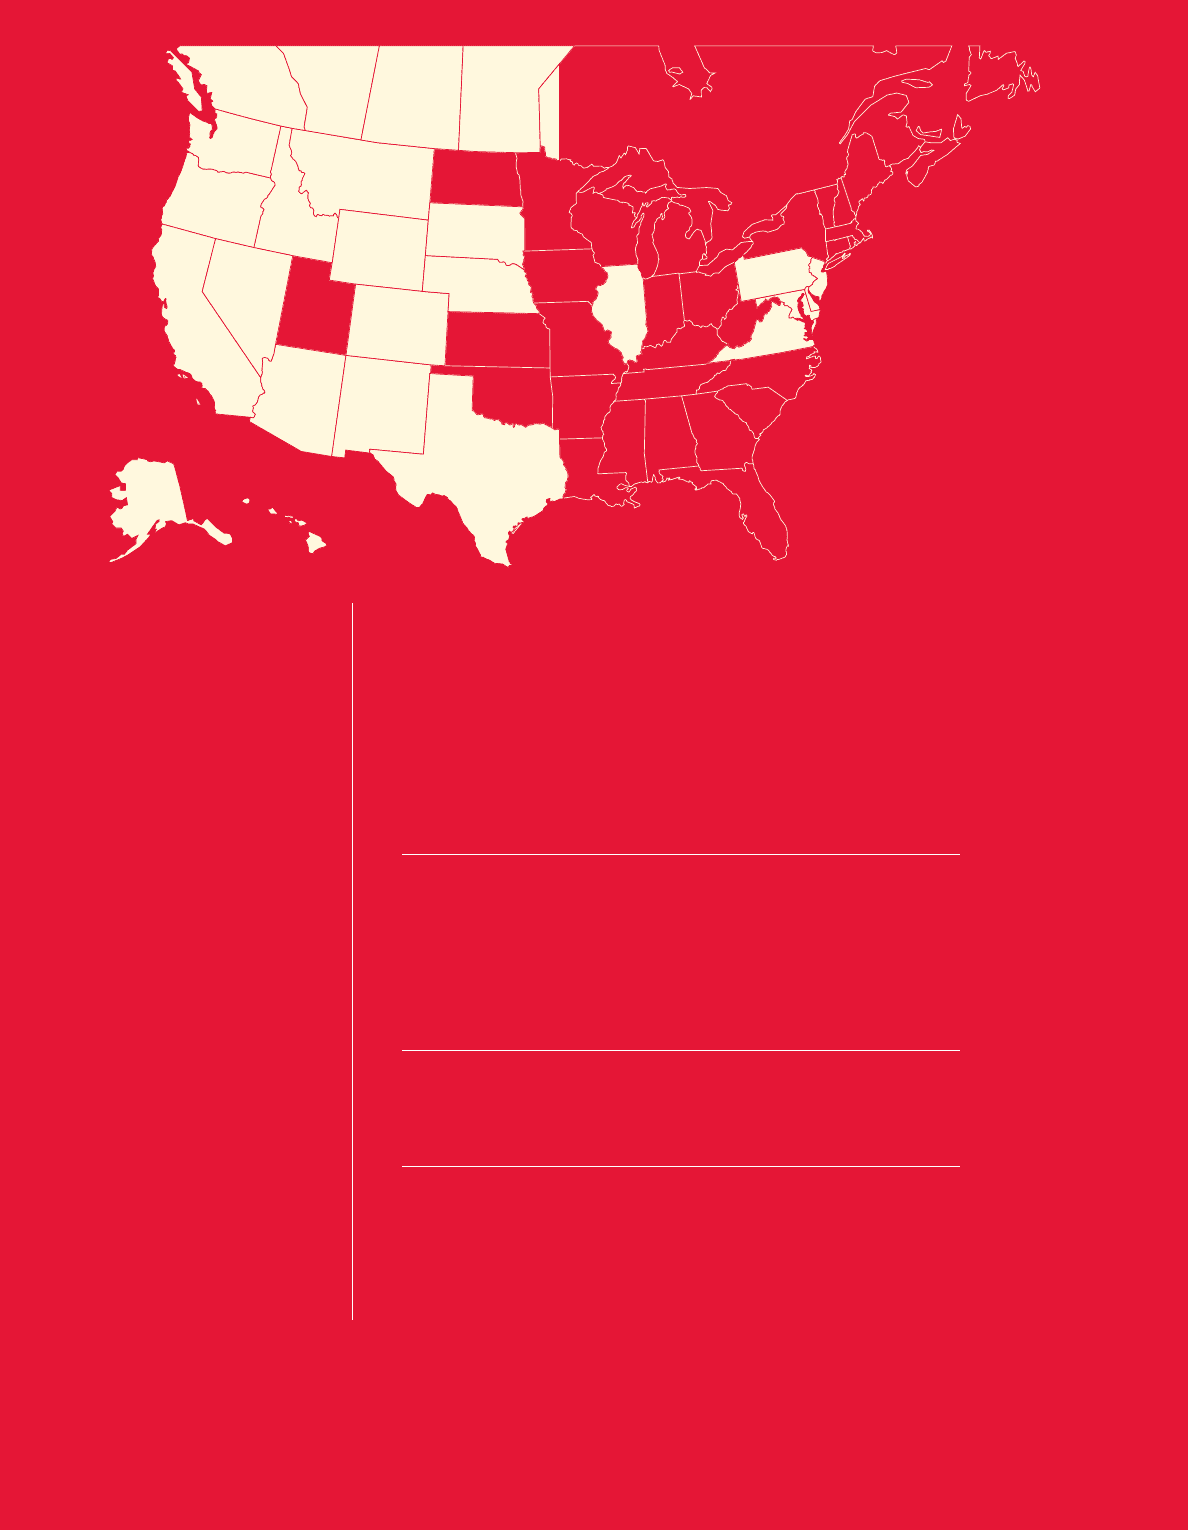
TABLE OF CONTENTS
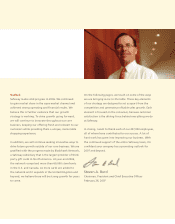
Letter to stockholders 2
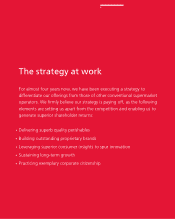
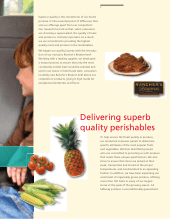
Quality 6
Proprietary brands 8
Innovation 10
Long-term growth 12
Corporate citizenship 14
Directors and
principal officers 16
Annual report on
Form 10-K 17
Investor information IBC
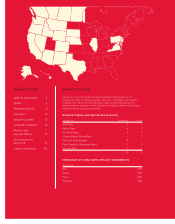
SAFEWAY AT A GLANCE
Safeway Inc. is one of the largest food and drug retailers in North America. As of
December 30, 2006, the company operated 1,761 stores in the Western, Southwestern,
Rocky Mountain, Midwestern and Mid-Atlantic regions of the United States and in
western Canada. In support of its stores, Safeway has an extensive network of distribution,
manufacturing and food processing facilities.
MANUFACTURING AND PROCESSING FACILITIES
Year-end 2006 United States Canada
Milk Plants 6 3
Bakery Plants 6 2
Ice Cream Plants 2 2
Cheese & Meat Packing Plants — 2
Soft Drink Bottling Plants 4 —
Fruit & Vegetable Processing Plants 1 3
Pet Food Plant 1 —
20 12
PERCENTAGE OF STORES WITH SPECIALTY DEPARTMENTS
Year-end 2006
Deli 97%
Bakery 95%
Floral 93%
Pharmacy 78%