Safeway 2006 Annual Report Download - page 25
Download and view the complete annual report
Please find page 25 of the 2006 Safeway annual report below. You can navigate through the pages in the report by either clicking on the pages listed below, or by using the keyword search tool below to find specific information within the annual report.-
 1
1 -
2
-
3
-
4
-
5
-
6
-
7
-
8
-
9
-
10
-
11
-
12
-
13
-
14
-
 15
15 -
 16
16 -
 17
17 -
 18
18 -
 19
19 -
 20
20 -
 21
21 -
 22
22 -
 23
23 -
 24
24 -
 25
25 -
 26
26 -
 27
27 -
 28
28 -
 29
29 -
 30
30 -
 31
31 -
 32
32 -
 33
33 -
 34
34 -
 35
35 -
36
-
37
-
38
-
39
-
40
-
41
-
42
-
43
-
44
-
45
-
46
-
47
-
48
-
49
-
50
-
51
-
52
-
53
-
54
-
55
-
56
-
57
-
58
-
59
-
60
-
61
-
62
-
63
-
64
-
65
-
66
-
67
-
68
-
69
-
70
-
71
-
72
-
73
-
74
-
75
-
76
-
77
-
78
-
79
-
80
-
81
-
82
-
83
-
84
-
85
-
86
-
87
-
88
-
89
-
90
-
91
-
92
-
93
 |
 |

SAFEWAY INC. AND SUBSIDIARIES
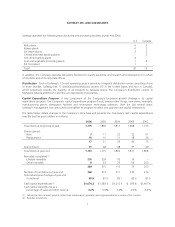
Safeway operated the following manufacturing and processing facilities at year-end 2006:
U.S. Canada
Milk plants 63
Bakery plants 62
Ice cream plants 22
Cheese and meat packing plants - 2
Soft drink bottling plants 4-
Fruit and vegetable processing plants 1 3
Pet food plant 1-
Total 20 12
In addition, the Company operates laboratory facilities for quality assurance and research and development in certain
of its plants and at its corporate offices.
Distribution Each of Safeway’s 12 retail operating areas is served by a regional distribution center consisting of one
or more facilities. Safeway has 17 distribution/warehousing centers (13 in the United States and four in Canada),
which collectively provide the majority of all products to Safeway stores. The Company’s distribution centers in
Maryland, Alberta and British Columbia are operated by third parties.
Capital Expenditure Program A key component of the Company’s long-term growth strategy is its capital
expenditure program. The Company’s capital expenditure program funds, among other things, new stores, remodels,
manufacturing plants, distribution facilities and information technology advances. Over the last several years,
Safeway’s management has continued to strengthen its program to select and approve new capital investments.
The table below details changes in the Company’s store base and presents the Company’s cash capital expenditures
over the last five years (dollars in millions):
2006 2005 2004 2003 2002
Total stores at beginning of year 1,775 1,802 1,817 1,808 1,773
Stores opened:
New 711 22 22 51
Replacement 10 10 11 18 24
17 21 33 40 75
Stores closed 31 48 48 31 40
Total stores at year end 1,761 1,775 1,802 1,817 1,808
Remodels completed (1):
Lifestyle remodels 276 293 92 19 –
Other remodels 822 23 56 203
284 315 115 75 203
Number of fuel stations at year end 340 314 311 270 214
Total retail square footage at year end
(in millions) 80.8 81.0 82.1 82.6 81.5
Cash capital expenditures (2) $1,674.2 $1,383.5 $1,212.5 $ 935.8 $1,467.4
Cash capital expenditures as a
percentage of sales and other revenue 4.2% 3.6% 3.4% 2.6% 4.2%
(1) Defined as store remodel projects (other than maintenance) generally requiring expenditures in excess of $0.2 million.
(2) Excludes acquisitions.
7