Safeway 2006 Annual Report Download - page 70
Download and view the complete annual report
Please find page 70 of the 2006 Safeway annual report below. You can navigate through the pages in the report by either clicking on the pages listed below, or by using the keyword search tool below to find specific information within the annual report.-
 1
1 -
2
-
3
-
4
-
5
-
6
-
7
-
8
-
9
-
10
-
11
-
12
-
13
-
14
-
15
-
16
-
17
-
18
-
19
-
20
-
21
-
22
-
23
-
24
-
25
-
26
-
27
-
28
-
29
-
30
-
31
-
32
-
33
-
34
-
35
-
36
-
37
-
38
-
39
-
40
-
41
-
42
-
43
-
44
-
45
-
46
-
47
-
48
-
49
-
50
-
51
-
52
-
53
-
54
-
55
-
56
-
57
-
58
-
59
-
 60
60 -
 61
61 -
 62
62 -
 63
63 -
 64
64 -
 65
65 -
 66
66 -
 67
67 -
 68
68 -
 69
69 -
 70
70 -
 71
71 -
 72
72 -
 73
73 -
 74
74 -
 75
75 -
 76
76 -
 77
77 -
 78
78 -
 79
79 -
 80
80 -
81
-
82
-
83
-
84
-
85
-
86
-
87
-
88
-
89
-
90
-
91
-
92
-
93
 |
 |

SAFEWAY INC. AND SUBSIDIARIES
Notes to Consolidated Financial Statements
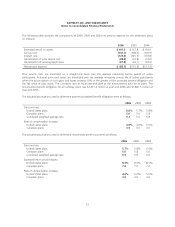
The total intrinsic value of options exercised was $32.0 million in 2006 and $26.6 million in 2005. As of year-end
2006, there was $118.6 million of total unrecognized compensation cost related to nonvested stock-based
compensation arrangements granted under the Company’s stock option plans. That cost is expected to be recognized
over a weighted average period of 1.6 years.
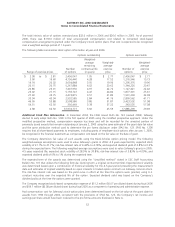
The following table summarizes stock option information at year-end 2006:
Options outstanding Options exercisable
Range of exercise prices
Number
of options
Weighted-
average
remaining
contractual life
(in years)
Weighted-
average
exercise
price
Number of
options
Weighted-
average
exercise
price
$ 2.38 to $ 2.81 2,456,047 1.05 $ 2.77 2,456,047 $ 2.77
3.00 19.60 4,756,440 4.28 17.52 1,276,946 15.73
19.74 20.02 3,654,848 3.55 19.96 1,295,376 19.96
20.15 20.75 5,267,884 4.02 20.62 1,344,226 20.47
20.86 23.01 7,407,956 4.97 22.72 1,127,421 22.42
23.02 27.15 5,159,747 4.47 24.82 1,877,301 25.61
27.40 35.75 2,473,815 3.57 31.89 1,931,293 32.38
35.94 45.94 2,932,585 2.84 41.76 2,809,562 41.71
46.09 53.88 3,508,986 3.86 51.87 3,423,592 51.98
54.51 62.50 356,469 3.78 57.22 343,535 57.08
2.38 62.50 37,974,777 3.92 25.59 17,885,299 29.69
Additional Stock Plan Information In December 2004, the FASB issued SFAS No. 123 (revised 2004). Safeway
elected to early adopt SFAS No. 123R in the first quarter of 2005 using the modified prospective approach. Under the
modified prospective method, compensation expense has been and will be recorded for the unvested portion of
previously issued awards that remain outstanding at January 2, 2005 using the same estimate of the grant date fair value
and the same attribution method used to determine the pro forma disclosure under SFAS No. 123. SFAS No. 123R
requires that all share-based payments to employees, including grants of employee stock options after January 1, 2005,
be recognized in the financial statements as compensation cost based on the fair value on the date of grant.
The Company determines fair value of such awards using the Black-Scholes option pricing model. The following
weighted-average assumptions were used to value Safeway’s grants in 2006: 4.5 years expected life; expected stock
volatility of 27.1% to 27.7%; risk-free interest rate of 4.43% to 4.78%; and expected dividend yield of 0.8% to 0.9%
during the expected term. The following weighted-average assumptions were used to value Safeway’s grants in 2005:
4.5 years expected life; expected stock volatility of 28.9% to 30.8%; risk-free interest rate of 3.83% to 4.09%; and
expected dividend yield of 0% to 1% during the expected term.
The expected term of the awards was determined using the “simplified method” stated in SEC Staff Accounting
Bulletin No. 107 that utilizes the following formula: ((vesting term + original contract term)/2). Expected stock volatility
was determined based upon a combination of historical volatility for the 4.5-year-period preceding the measurement
date and estimates of implied volatility based on open interests in traded option contracts on Safeway common stock.
The risk-free interest rate was based on the yield curve in effect at the time the options were granted, using U.S.
constant maturities over the expected life of the option. Expected dividend yield was based on the Company’s
dividend policy at the time the options were granted.
The Company recognized stock-based compensation expense of $51.2 million ($0.07 per diluted share) during fiscal 2006
and $59.7 million ($0.08 per diluted share) during fiscal 2005 as a component of operating and administrative expense.
Had compensation cost for Safeway’s stock option plans been determined based on the fair value at the grant date for
awards from 1996 through 2004, consistent with the provisions of SFAS No. 123, the Company’s net income and
earnings per share would have been reduced to the pro forma amounts disclosed in Note A.
52