Safeway 2006 Annual Report Download - page 68
Download and view the complete annual report
Please find page 68 of the 2006 Safeway annual report below. You can navigate through the pages in the report by either clicking on the pages listed below, or by using the keyword search tool below to find specific information within the annual report.-
 1
1 -
2
-
3
-
4
-
5
-
6
-
7
-
8
-
9
-
10
-
11
-
12
-
13
-
14
-
15
-
16
-
17
-
18
-
19
-
20
-
21
-
22
-
23
-
24
-
25
-
26
-
27
-
28
-
29
-
30
-
31
-
32
-
33
-
34
-
35
-
36
-
37
-
38
-
39
-
40
-
41
-
42
-
43
-
44
-
45
-
46
-
47
-
48
-
49
-
50
-
51
-
52
-
53
-
54
-
55
-
56
-
57
-
 58
58 -
 59
59 -
 60
60 -
 61
61 -
 62
62 -
 63
63 -
 64
64 -
 65
65 -
 66
66 -
 67
67 -
 68
68 -
 69
69 -
 70
70 -
 71
71 -
 72
72 -
 73
73 -
 74
74 -
 75
75 -
 76
76 -
 77
77 -
 78
78 -
79
-
80
-
81
-
82
-
83
-
84
-
85
-
86
-
87
-
88
-
89
-
90
-
91
-
92
-
93
 |
 |

SAFEWAY INC. AND SUBSIDIARIES
Notes to Consolidated Financial Statements
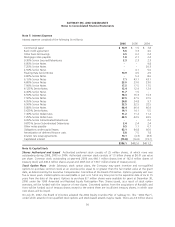
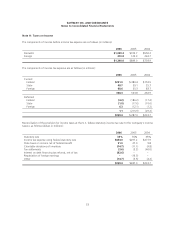
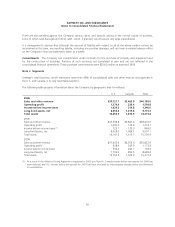
Note F: Interest Expense
Interest expense consisted of the following (in millions):
2006 2005 2004
Commercial paper $ 10.9 $ 1.5 $ 7.8
Bank credit agreement 5.6 3.3 4.0
Other bank borrowings 0.5 0.2 0.4
Mortgage notes payable 1.8 2.1 2.4
9.30% Senior Secured Debentures 2.3 2.3 2.3
6.85% Senior Notes -- 9.8
7.25% Senior Notes -- 20.3
2.50% Senior Notes -4.1 5.0
Floating Rate Senior Notes 10.9 4.5 2.9
3.80% Senior Notes -5.3 8.6
6.15% Senior Notes 7.1 43.1 43.1
4.80% Senior Notes 23.0 23.0 23.0
7.00% Senior Notes 17.5 17.5 17.5
4.125% Senior Notes 12.4 12.4 12.4
4.45% Senior Notes 11.7 1.5 -
6.50% Senior Notes 16.3 16.3 16.3
7.50% Senior Notes 37.5 37.5 37.5
4.95% Senior Notes 24.8 24.8 9.7
6.50% Senior Notes 32.5 32.5 32.5
5.80% Senior Notes 46.4 46.4 46.4
5.625% Senior Notes 14.1 14.1 5.5
7.45% Senior Debentures 11.2 11.2 11.2
7.25% Senior Debentures 43.5 43.5 43.5
9.65% Senior Subordinated Debentures -- 0.2
9.875% Senior Subordinated Debentures 2.4 2.4 2.4
Other notes payable 0.5 1.1 0.7
Obligations under capital leases 63.1 64.8 66.0
Amortization of deferred finance costs 5.8 7.5 7.8
Interest rate swap agreements 10.1 (4.3) (8.3)
Capitalized interest (15.8) (16.0) (19.7)
$396.1 $402.6 $411.2
Note G: Capital Stock
Shares Authorized and Issued Authorized preferred stock consists of 25 million shares, of which none was
outstanding during 2006, 2005 or 2004. Authorized common stock consists of 1.5 billion shares at $0.01 par value
per share. Common stock outstanding at year-end 2006 was 440.1 million shares (net of 142.4 million shares of
treasury stock) and 449.4 million shares at year-end 2005 (net of 130.7 million shares of treasury stock).
Stock Option Plans Under Safeway’s stock option plans, the Company may grant incentive and non-qualified
options to purchase common stock at an exercise price equal to or greater than the fair market value at the grant
date, as determined by the Executive Compensation Committee of the Board of Directors. Options generally vest over
five or seven years. Vested options are exercisable in part or in full at any time prior to the expiration date of six to 15
years from the date of the grant. Options to purchase 8.7 million shares were available for grant at December 30,
2006 under the 1999 Amended and Restated Equity Participation Plan. Shares issued, as a result of stock option
exercises, will be funded with the issuance of new shares. Converted options from the acquisitions of Randall’s and
Vons will be funded out of treasury shares except to the extent there are insufficient treasury shares, in which case
new shares will be issued.
On July 31, 2002, the Board of Directors adopted the 2002 Equity Incentive Plan of Safeway Inc. (the “2002 Plan”),
under which awards of non-qualified stock options and stock-based awards may be made. There are 2.0 million shares
50