Safeway 2006 Annual Report Download - page 78
Download and view the complete annual report
Please find page 78 of the 2006 Safeway annual report below. You can navigate through the pages in the report by either clicking on the pages listed below, or by using the keyword search tool below to find specific information within the annual report.-
 1
1 -
2
-
3
-
4
-
5
-
6
-
7
-
8
-
9
-
10
-
11
-
12
-
13
-
14
-
15
-
16
-
17
-
18
-
19
-
20
-
21
-
22
-
23
-
24
-
25
-
26
-
27
-
28
-
29
-
30
-
31
-
32
-
33
-
34
-
35
-
36
-
37
-
38
-
39
-
40
-
41
-
42
-
43
-
44
-
45
-
46
-
47
-
48
-
49
-
50
-
51
-
52
-
53
-
54
-
55
-
56
-
57
-
58
-
59
-
60
-
61
-
62
-
63
-
64
-
65
-
66
-
67
-
 68
68 -
 69
69 -
 70
70 -
 71
71 -
 72
72 -
 73
73 -
 74
74 -
 75
75 -
 76
76 -
 77
77 -
 78
78 -
 79
79 -
 80
80 -
 81
81 -
 82
82 -
 83
83 -
 84
84 -
 85
85 -
 86
86 -
 87
87 -
 88
88 -
89
-
90
-
91
-
92
-
93
 |
 |

SAFEWAY INC. AND SUBSIDIARIES
Notes to Consolidated Financial Statements
There are also pending against the Company various claims and lawsuits arising in the normal course of business,
some of which seek damages and other relief, which, if granted, would require very large expenditures.
It is management’s opinion that although the amount of liability with respect to all of the above matters cannot be
ascertained at this time, any resulting liability, including any punitive damages, will not have a material adverse effect
on the Company’s financial statements taken as a whole.
Commitments The Company has commitments under contracts for the purchase of property and equipment and
for the construction of buildings. Portions of such contracts not completed at year end are not reflected in the
consolidated financial statements. These purchase commitments were $254.0 million at year-end 2006.
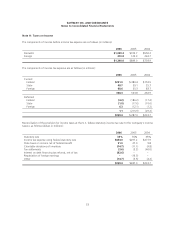
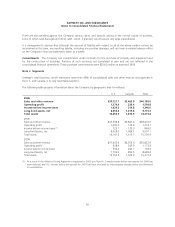
Note L: Segments
Safeway’s retail business, which represents more than 98% of consolidated sales and other revenue and operates in
the U.S. and Canada, is its only reportable segment.
The following table presents information about the Company by geographic area (in millions):
U.S. Canada Total
2006
Sales and other revenue $34,721.1 $5,463.9 $40,185.0
Operating profit 1,370.4 229.4 1,599.8
Income before income taxes 1,029.2 210.8 1,240.0
Long-lived assets, net 8,553.5 1,219.8 9,773.3
Total assets 14,456.9 1,816.9 16,273.8
2005
Sales and other revenue $33,568.8 $4,847.2 $38,416.0
Operating profit 1,090.9 123.8 1,214.7
Income before income taxes (1) 723.7 125.3 849.0
Long-lived assets, net 8,028.0 1,069.1 9,097.1
Total assets 14,141.2 1,615.7 15,756.9
2004
Sales and other revenue $31,463.0 $4,359.9 $35,822.9
Operating profit 928.9 243.9 1,172.8
Income before income taxes 550.2 243.7 793.9
Long-lived assets, net 7,796.9 892.5 8,689.4
Total assets 13,753.5 1,623.9 15,377.4
(1) As a result of the Advance Pricing Agreement negotiated in 2005 (see Note H), Canada income before tax expense for 2005 has
been reduced, and U.S. income before tax expense for 2005 has been increased by intercompany charges which are eliminated
in consolidation.
60