Safeway 2006 Annual Report Download - page 3
Download and view the complete annual report
Please find page 3 of the 2006 Safeway annual report below. You can navigate through the pages in the report by either clicking on the pages listed below, or by using the keyword search tool below to find specific information within the annual report.-
 1
1 -
 2
2 -
 3
3 -
 4
4 -
 5
5 -
 6
6 -
 7
7 -
 8
8 -
 9
9 -
 10
10 -
 11
11 -
 12
12 -
 13
13 -
 14
14 -
15
-
16
-
17
-
18
-
19
-
20
-
21
-
22
-
23
-
24
-
25
-
26
-
27
-
28
-
29
-
30
-
31
-
32
-
33
-
34
-
35
-
36
-
37
-
38
-
39
-
40
-
41
-
42
-
43
-
44
-
45
-
46
-
47
-
48
-
49
-
50
-
51
-
52
-
53
-
54
-
55
-
56
-
57
-
58
-
59
-
60
-
61
-
62
-
63
-
64
-
65
-
66
-
67
-
68
-
69
-
70
-
71
-
72
-
73
-
74
-
75
-
76
-
77
-
78
-
79
-
80
-
81
-
82
-
83
-
84
-
85
-
86
-
87
-
88
-
89
-
90
-
91
-
92
-
93
 |
 |
Pantone® Reex Blue
CMYK 100-82-0-2
RGB 0-51-153
Hex 003399
Pantone® 186
CMYK 0-91-76-6
RGB 228-23-32
Hex E41720
White
CMYK 0-0-0-0
RGB 255-255-255
Hex FFFFFF
Pantone® Reex Blue
CMYK 100-82-0-2
RGB 0-51-153
Hex 003399
Pantone® 186
CMYK 0-91-76-6
RGB 228-23-32
Hex E41720
White
CMYK 0-0-0-0
RGB 255-255-255
Hex FFFFFF
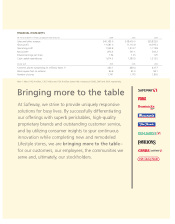
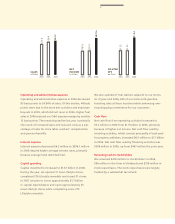
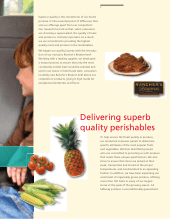
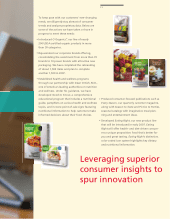
At Safeway, we strive to provide uniquely responsive
solutions for busy lives. By successfully differentiating
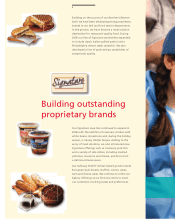
our offerings with superb perishables, high-quality
proprietary brands and outstanding customer service,
and by utilizing consumer insights to spur continuous
innovation while completing new and remodeled
Lifestyle stores, we are bringing more to the table –
for our customers, our employees, the communities we
serve and, ultimately, our stockholders.
Bringing more to the table
FINANCIAL HIGHLIGHTS
For the year (dollars in millions, except per-share amounts) 2006 2005 2004
Sales and other revenue $40,185.0 $38,416.0 $35,822.9
Gross profi t 11,581.0 11,112.9 10,595.3
Operating profi t 1,599.8 1,214.7 1,172.8
Net income 870.6 561.1 560.2
Diluted earnings per share 1.94 1.25 1.25
Cash capital expenditures 1,674.2 1,383.5 1,212.5
At year end 2006 2005 2004
Common shares outstanding (in millions) (Note 1) 440.1 449.4 447.7
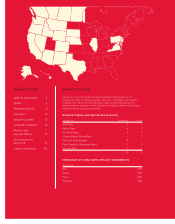
Retail square feet (in millions) 80.8 81.0 82.1
Number of stores 1,761 1,775 1,802
Note 1: Net of 142.4 million, 130.7 million and 130.8 million shares held in treasury in 2006, 2005 and 2004, respectively.Note 1: Net of 142.4 million, 130.7 million and 130.8 million shares held in treasury in 2006, 2005 and 2004, respectively.