Safeway 2006 Annual Report Download - page 48
Download and view the complete annual report
Please find page 48 of the 2006 Safeway annual report below. You can navigate through the pages in the report by either clicking on the pages listed below, or by using the keyword search tool below to find specific information within the annual report.-
 1
1 -
2
-
3
-
4
-
5
-
6
-
7
-
8
-
9
-
10
-
11
-
12
-
13
-
14
-
15
-
16
-
17
-
18
-
19
-
20
-
21
-
22
-
23
-
24
-
25
-
26
-
27
-
28
-
29
-
30
-
31
-
32
-
33
-
34
-
35
-
36
-
37
-
 38
38 -
 39
39 -
 40
40 -
 41
41 -
 42
42 -
 43
43 -
 44
44 -
 45
45 -
 46
46 -
 47
47 -
 48
48 -
 49
49 -
 50
50 -
 51
51 -
 52
52 -
 53
53 -
 54
54 -
 55
55 -
 56
56 -
 57
57 -
 58
58 -
59
-
60
-
61
-
62
-
63
-
64
-
65
-
66
-
67
-
68
-
69
-
70
-
71
-
72
-
73
-
74
-
75
-
76
-
77
-
78
-
79
-
80
-
81
-
82
-
83
-
84
-
85
-
86
-
87
-
88
-
89
-
90
-
91
-
92
-
93
 |
 |

SAFEWAY INC. AND SUBSIDIARIES
SFAS No. 133, “Accounting for Derivative Instruments and Hedging Activities,” they are not marked to market. Energy
purchased under these contracts is expensed as delivered.
New Accounting Standards
In June 2006, the Financial Accounting Standards Board (“FASB”) issued FASB Interpretation No. 48, “Accounting for
Uncertainty in Income Taxes – an interpretation of FASB Statement No. 109” (“FIN 48”) which will be effective for
Safeway in the first quarter of 2007. FIN 48 prescribes a recognition threshold and measurement attribute for the
financial statement recognition and measurement of tax positions taken or expected to be taken in tax returns. For
benefits to be realized a tax position must be more likely than not to be sustained upon examination. The amount
recognized is measured as the largest amount of benefit that is greater than 50 percent likely of being realized upon
settlement.
Safeway is currently assessing the impact of FIN 48 on its financial statements. Safeway estimates the cumulative effect
of adopting FIN 48 will increase stockholders’ equity by approximately $120 million to $150 million as of the
beginning of fiscal 2007.
In September 2006, the FASB issued SFAS No. 157, “Fair Value Measurement.” SFAS No. 157 defines fair value,
establishes a framework for measuring fair value in generally accepted accounting principles, and expands disclosures
about fair value measurements. This Statement does not require any new fair value measurements. SFAS No. 157 is
effective for fiscal years beginning after November 15, 2007 and interim periods within those fiscal years. Safeway is
currently assessing the impact of SFAS No. 157 on its financial statements.
In February 2007, the FASB issued SFAS No. 159, “The Fair Value Option for Financial Assets and Financial Liabilities–
Including an amendment of FASB Statement No. 115.” SFAS No. 159 permits companies to measure many financial
instruments and certain other items at fair value at specified election dates. Unrealized gains and losses on these items
will be reported in earnings at each subsequent reporting date. The fair value option may be applied instrument by
instrument (with a few exceptions), is irrevocable and is applied only to entire instruments and not to portions of
instruments. SFAS No. 159 is effective for fiscal years beginning after November 15, 2007. Safeway is currently
assessing the impact of SFAS No. 159 on its financial statements.
Item 7A. Quantitative and Qualitative Disclosures About Market Risk
Safeway manages interest rate risk through the strategic use of fixed and variable interest rate debt and, from time to
time, interest rate swaps. As of year-end 2006, the Company effectively converted $500 million of its 4.95% fixed-rate
debt and $300 million of its 4.125% fixed-rate debt to floating-rate debt through interest rate swap agreements.
During 2006 the weighted-average pay rate on the $500 million debt was 5.68%, and the weighted-average pay rate
on the $300 million debt was 5.77%. The fair value of these interest rate swaps at year-end 2006 was a liability of
$25.9 million.
The Company does not utilize financial instruments for trading or other speculative purposes, nor does it utilize
leveraged financial instruments. The Company does not consider the potential declines in future earnings, fair values
and cash flows from reasonably possible near-term changes in interest rates and exchange rates to be material.
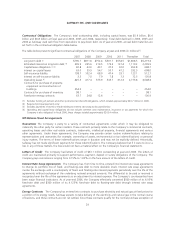
The table below presents principal amounts and related weighted-average rates by year of maturity for the Company’s
debt obligations at year-end 2006 (dollars in millions):
2007 2008 2009 2010 2011 Thereafter Total Fair value
Long-term debt: (1)
Principal $ 790.7 $ 811.6 $ 752.4 $ 501.7 $ 554.5 $1,808.5 $5,219.4 $5,318.6
Weighted average
interest rate 5.80% 4.98% 6.90% 4.96% 6.31% 6.40% 6.01%
(1) Primarily fixed-rate debt
30