Safeway 2006 Annual Report Download - page 40
Download and view the complete annual report
Please find page 40 of the 2006 Safeway annual report below. You can navigate through the pages in the report by either clicking on the pages listed below, or by using the keyword search tool below to find specific information within the annual report.-
 1
1 -
2
-
3
-
4
-
5
-
6
-
7
-
8
-
9
-
10
-
11
-
12
-
13
-
14
-
15
-
16
-
17
-
18
-
19
-
20
-
21
-
22
-
23
-
24
-
25
-
26
-
27
-
28
-
29
-
 30
30 -
 31
31 -
 32
32 -
 33
33 -
 34
34 -
 35
35 -
 36
36 -
 37
37 -
 38
38 -
 39
39 -
 40
40 -
 41
41 -
 42
42 -
 43
43 -
 44
44 -
 45
45 -
 46
46 -
 47
47 -
 48
48 -
 49
49 -
 50
50 -
51
-
52
-
53
-
54
-
55
-
56
-
57
-
58
-
59
-
60
-
61
-
62
-
63
-
64
-
65
-
66
-
67
-
68
-
69
-
70
-
71
-
72
-
73
-
74
-
75
-
76
-
77
-
78
-
79
-
80
-
81
-
82
-
83
-
84
-
85
-
86
-
87
-
88
-
89
-
90
-
91
-
92
-
93
 |
 |

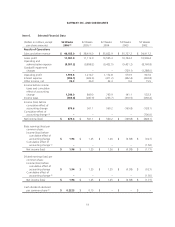
SAFEWAY INC. AND SUBSIDIARIES
In 2004 Safeway was notified that it was required to contribute an additional $31.1 million before tax ($0.04 per
diluted share) during the year to two Northern California multi-employer health and welfare plans for its share of
funding deficits.
On February 7, 2005, the Office of the Chief Accountant of the Securities and Exchange Commission issued a letter to
the American Institute of Certified Public Accountants expressing its view regarding certain lease-related accounting
issues and their application under generally accepted accounting principles (“GAAP”). In light of this letter, Safeway
determined that its then-current method of accounting for rent holidays was not in accordance with GAAP.
Historically, the Company recognized rent expense on a straight-line basis beginning at the first rent payment. The
Company now recognizes rent expense on a straight-line basis when it takes possession and control of the property.
Safeway recorded a $10.6 million before-tax charge ($0.01 per diluted share) in 2004 to correct this error. However,
most of the adjustment was accumulated over many years.
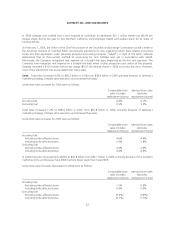
Sales Total sales increased 4.6% to $40.2 billion in 2006 from $38.4 billion in 2005 primarily because of Safeway’s
marketing strategy, Lifestyle store execution and increased fuel sales.
Same-store sales increases for 2006 were as follows:
Comparable-store
sales (includes
replacement stores)
Identical-store sales
(excludes
replacement stores)
Including fuel 4.4% 4.1%
Excluding fuel 3.5% 3.3%
Total sales increased 7.2% to $38.4 billion in 2005 from $35.8 billion in 2004, primarily because of Safeway’s
marketing strategy, Lifestyle store execution and increased fuel sales.
Same-store sales increases for 2005 were as follows:
Comparable-store
sales (includes
replacement stores)
Identical-store sales
(excludes
replacement stores)
Including fuel:
Excluding strike-affected stores 4.6% 4.4%
Including strike-affected stores 5.9% 5.8%
Excluding fuel:
Excluding strike-affected stores 3.0% 2.9%
Including strike-affected stores 4.4% 4.3%
In 2004 total sales increased only slightly to $35.8 billion from $35.7 billion in 2003, primarily because of the Southern
California strike and because fiscal 2004 had one fewer week than fiscal 2003.
Same-store sales increases (decreases) for 2004 were as follows:
Comparable-store
sales (includes
replacement stores)
Identical-store sales
(excludes
replacement stores)
Including fuel:
Excluding strike-affected stores 1.5% 0.9%
Including strike-affected stores 0.9% 0.3%
Excluding fuel:
Excluding strike-affected stores (0.2%) (0.8%)
Including strike-affected stores (0.7%) (1.3%)
22