Safeway 2006 Annual Report Download - page 42
Download and view the complete annual report
Please find page 42 of the 2006 Safeway annual report below. You can navigate through the pages in the report by either clicking on the pages listed below, or by using the keyword search tool below to find specific information within the annual report.-
 1
1 -
2
-
3
-
4
-
5
-
6
-
7
-
8
-
9
-
10
-
11
-
12
-
13
-
14
-
15
-
16
-
17
-
18
-
19
-
20
-
21
-
22
-
23
-
24
-
25
-
26
-
27
-
28
-
29
-
30
-
31
-
 32
32 -
 33
33 -
 34
34 -
 35
35 -
 36
36 -
 37
37 -
 38
38 -
 39
39 -
 40
40 -
 41
41 -
 42
42 -
 43
43 -
 44
44 -
 45
45 -
 46
46 -
 47
47 -
 48
48 -
 49
49 -
 50
50 -
 51
51 -
 52
52 -
53
-
54
-
55
-
56
-
57
-
58
-
59
-
60
-
61
-
62
-
63
-
64
-
65
-
66
-
67
-
68
-
69
-
70
-
71
-
72
-
73
-
74
-
75
-
76
-
77
-
78
-
79
-
80
-
81
-
82
-
83
-
84
-
85
-
86
-
87
-
88
-
89
-
90
-
91
-
92
-
93
 |
 |
SAFEWAY INC. AND SUBSIDIARIES
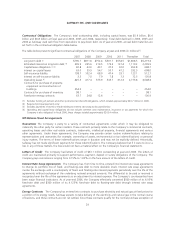
expense, labor costs associated with the grand opening of Lifestyle stores and higher energy costs also increased
operating and administrative expense, as a percentage of sales. These items were more than offset by restructured
labor agreements, increased fuel sales and reduced workers’ compensation costs.
Operating and administrative expense decreased seven basis points in 2004. Lower impairment charges reduced
operating and administrative expense as a percentage of sales by 77 basis points, and higher fuel sales reduced
operating and administrative expense by 39 basis points. These improvements were offset by a 22-basis-point increase
from the strike in Southern California and 87 basis points due to higher wages, benefits and occupancy expense.
Interest Expense Interest expense was $396.1 million in 2006, compared to $402.6 million in 2005 and $411.2
million in 2004. Interest expense decreased in 2006 and 2005 primarily due to lower average borrowings, partially
offset by a higher average interest rate. Interest expense also decreased in 2004, primarily due to lower average
borrowings in 2004 compared to 2003.
Other Income Other income consists of interest income, minority interest in a consolidated affiliate and equity in
earnings from Safeway’s unconsolidated affiliates. Interest income was $11.1 million in 2006, $12.7 million in 2005
and $9.7 million in 2004. Equity in earnings of unconsolidated affiliates was income of $21.1 million in 2006, $15.8
million in 2005 and $12.6 million in 2004.
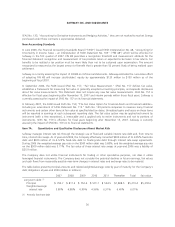
Income Taxes The Company’s effective tax rates for 2006, 2005 and 2004 were 29.8%, 33.9% and 29.4%,
respectively. The effective tax rate for 2006 includes a benefit of $62.6 million related to interest, net of income tax, on
federal and state income tax refunds, and various other favorable items. Further description of the federal and state
refunds is provided below. The effective tax rate for 2005 included a tax benefit from the repatriation of foreign earnings
under the American Jobs Creation Act of 2004 and a tax benefit from the favorable resolution of certain tax issues. In
2004 the effective tax rate included benefits related to tax law changes and the resolution of certain tax issues.
On April 10, 2006, Safeway announced that it had settled federal income tax refund claims for the years 1992
through 1999 for costs associated with debt financing. The federal refund consisted of a tax refund of $259.2 million
and interest, net of income tax, of $60.8 million. The state income tax refunds received in 2006 consisted of $3.1
million of state tax and $1.8 million of state interest, net of income tax. The federal and state tax refunds of $259.2
million and $3.1 million were recorded in 2006 as an increase to additional paid-in capital since the tax deductions
associated with the debt financing exceeded the previously recognized book expense.
Critical Accounting Policies and Estimates
Critical accounting policies are those accounting policies that management believes are important to the portrayal of
Safeway’s financial condition and results of operations and require management’s most difficult, subjective or complex
judgments, often as a result of the need to make estimates about the effect of matters that are inherently uncertain.
Workers’ Compensation The Company is primarily self-insured for workers’ compensation, automobile and general
liability costs. It is the Company’s policy to record its self-insurance liability, as determined actuarially, based on claims
filed and an estimate of claims incurred but not yet reported, discounted at a risk-free interest rate. Any actuarial
projection of losses concerning workers’ compensation and general liability is subject to a high degree of variability.
Among the causes of this variability are unpredictable external factors affecting future inflation rates, discount rates,
litigation trends, legal interpretations, benefit level changes and claim settlement patterns. A 25-basis-point increase in
the Company’s discount rate would reduce its liability by approximately $4.5 million.
The majority of the Company’s workers’ compensation liability is from claims occurring in California. California
workers’ compensation has received intense scrutiny from the state’s politicians, insurers, employers and providers, as
well as the public in general. Recent years have seen escalation in the number of legislative reforms, judicial rulings
and social phenomena affecting this business. Some of the many sources of uncertainty in the Company’s reserve
estimates include changes in benefit levels, medical fee schedules, medical utilization guidelines, vocation
rehabilitation and apportionment.
24