Safeway 2006 Annual Report Download - page 41
Download and view the complete annual report
Please find page 41 of the 2006 Safeway annual report below. You can navigate through the pages in the report by either clicking on the pages listed below, or by using the keyword search tool below to find specific information within the annual report.-
 1
1 -
2
-
3
-
4
-
5
-
6
-
7
-
8
-
9
-
10
-
11
-
12
-
13
-
14
-
15
-
16
-
17
-
18
-
19
-
20
-
21
-
22
-
23
-
24
-
25
-
26
-
27
-
28
-
29
-
30
-
 31
31 -
 32
32 -
 33
33 -
 34
34 -
 35
35 -
 36
36 -
 37
37 -
 38
38 -
 39
39 -
 40
40 -
 41
41 -
 42
42 -
 43
43 -
 44
44 -
 45
45 -
 46
46 -
 47
47 -
 48
48 -
 49
49 -
 50
50 -
 51
51 -
52
-
53
-
54
-
55
-
56
-
57
-
58
-
59
-
60
-
61
-
62
-
63
-
64
-
65
-
66
-
67
-
68
-
69
-
70
-
71
-
72
-
73
-
74
-
75
-
76
-
77
-
78
-
79
-
80
-
81
-
82
-
83
-
84
-
85
-
86
-
87
-
88
-
89
-
90
-
91
-
92
-
93
 |
 |
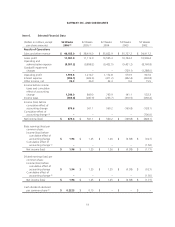
SAFEWAY INC. AND SUBSIDIARIES
Gross Profit Gross profit represents the portion of sales revenue remaining after deducting the cost of goods sold
during the period, including purchase and distribution costs. These costs include inbound freight charges, purchasing
and receiving costs, warehouse inspection costs, warehousing costs, and other costs associated with Safeway’s
distribution network. Advertising and promotional expenses are also a component of cost of goods sold. Additionally,
all vendor allowances are classified as an element of cost of goods sold.
Gross profit margin was 28.82% of sales in 2006, 28.93% in 2005, and 29.58% in 2004.
Gross profit decreased 11 basis points to 28.82% of sales in 2006 from 28.93% of sales in 2005. Higher fuel sales
reduced gross profit by 28 basis points. Excluding fuel, gross profit increased 17 basis points primarily because of
improved shrink, benefits from product-sourcing initiatives and improved product mix, partly offset by investments in
price and increased advertising expense.
The gross profit margin decreased 65 basis points to 28.93% of sales in 2005 from 29.58% in 2004. Higher fuel sales
reduced gross profit by 39 basis points. The remaining decline is due to grand openings of Lifestyle stores, investment
in price, increased advertising expense and higher energy costs.
Gross profit declined 44 basis points in 2004. The strike in Southern California reduced gross profit by an estimated 41
basis points, and higher fuel sales reduced gross profit by 40 basis points. These decreases were offset somewhat by a
17-basis-point increase, primarily the result of targeted pricing and promotion.
Vendor allowances totaled $2.5 billion in 2006, $2.4 billion in 2005 and $2.2 billion in 2004. Vendor allowances can
be grouped into the following broad categories: promotional allowances, slotting allowances and contract allowances.
All vendor allowances are classified as an element of cost of goods sold.
Promotional allowances make up approximately three-quarters of all allowances. With promotional allowances,
vendors pay Safeway to promote their product. The promotion may be any combination of a temporary price
reduction, a feature in print ads, a feature in a Safeway circular, or a preferred location in the store. The promotions
are typically one to two weeks long.
Slotting allowances are a small portion of total allowances (typically less than 5% of all allowances). With slotting
allowances, the vendor reimburses Safeway for the cost of placing new product on the shelf. Safeway has no
obligation or commitment to keep the product on the shelf for a minimum period.
Contract allowances make up the remainder of all allowances. Under the typical contract allowance, a vendor pays
Safeway to keep product on the shelf for a minimum period of time or when volume thresholds are achieved.
Operating and Administrative Expense Operating and administrative expense consists primarily of store
occupancy costs and backstage expenses, which, in turn, consist primarily of wages, employee benefits, rent,
depreciation and utilities.
Operating and administrative expense was 24.84% of sales in 2006 compared to 25.77% in 2005 and 26.30% in 2004.
Operating and administrative expense decreased 93 basis points to 24.84% of sales in 2006 from 25.77% of sales in
2005. The store exit activities and employee buyouts in 2005 reduced operating and administrative expense by 44
basis points. Higher fuel sales in 2006 reduced operating and administrative expense by 13 basis points. The remaining
decline is primarily the result of increased sales and reduced costs as a percentage of sales from store labor, workers’
compensation and pension expense.
Operating and administrative expense decreased 53 basis points in 2005 to 25.77% of sales from 26.30% in 2004.
The significant pre-tax charges discussed above (impairment of long-lived assets, store exit activities and employee
buyouts in 2005 combined with store exit activities, health and welfare contributions and the accrual for rent holidays
in 2004) increased operating and administrative expense, as a percentage of sales, by 20 basis points. Stock option
23