Safeway 2006 Annual Report Download - page 56
Download and view the complete annual report
Please find page 56 of the 2006 Safeway annual report below. You can navigate through the pages in the report by either clicking on the pages listed below, or by using the keyword search tool below to find specific information within the annual report.-
 1
1 -
2
-
3
-
4
-
5
-
6
-
7
-
8
-
9
-
10
-
11
-
12
-
13
-
14
-
15
-
16
-
17
-
18
-
19
-
20
-
21
-
22
-
23
-
24
-
25
-
26
-
27
-
28
-
29
-
30
-
31
-
32
-
33
-
34
-
35
-
36
-
37
-
38
-
39
-
40
-
41
-
42
-
43
-
44
-
45
-
 46
46 -
 47
47 -
 48
48 -
 49
49 -
 50
50 -
 51
51 -
 52
52 -
 53
53 -
 54
54 -
 55
55 -
 56
56 -
 57
57 -
 58
58 -
 59
59 -
 60
60 -
 61
61 -
 62
62 -
 63
63 -
 64
64 -
 65
65 -
 66
66 -
67
-
68
-
69
-
70
-
71
-
72
-
73
-
74
-
75
-
76
-
77
-
78
-
79
-
80
-
81
-
82
-
83
-
84
-
85
-
86
-
87
-
88
-
89
-
90
-
91
-
92
-
93
 |
 |

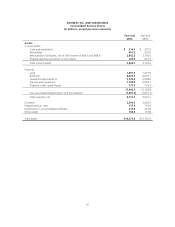
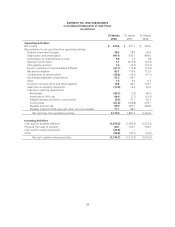
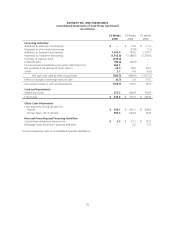
SAFEWAY INC. AND SUBSIDIARIES
Consolidated Statements of Cash Flows
(In millions)
52 Weeks
2006
52 Weeks
2005
52 Weeks
2004
Operating Activities:
Net income $ 870.6 $ 561.1 $ 560.2
Reconciliation to net cash flow from operating activities:
Property impairment charges 39.2 78.9 39.4
Depreciation and amortization 991.4 932.7 894.6
Amortization of deferred finance costs 5.8 7.5 7.8
Deferred income taxes 1.1 (215.9) (29.2)
LIFO expense (income) 1.2 (0.2) (15.2)
Equity in earnings of unconsolidated affiliates (21.1) (15.8) (12.6)
Net pension expense 83.1 115.6 112.9
Contributions to pension plans (29.2) (18.1) (15.1)
Stock-based employee compensation 51.2 59.7 –
Other 7.3 6.9 6.7
Long-term accrued claims and other liabilities 10.8 44.1 118.1
(Gain) loss on property retirements (17.8) 13.6 20.6
Changes in working capital items:
Receivables (45.1) (1.0) 46.3
Inventories at FIFO cost 96.9 (7.7) (61.9)
Prepaid expenses and other current assets (9.3) 37.1 50.9
Income taxes (21.2) (128.8) 218.1
Payables and accruals 89.0 363.1 284.8
Payables related to third-party gift cards, net of receivables 71.1 48.2 –
Net cash flow from operating activities 2,175.0 1,881.0 2,226.4
Investing Activities:
Cash paid for property additions (1,674.2) (1,383.5) (1,212.5)
Proceeds from sale of property 80.1 105.1 194.7
Cash used to acquire businesses (83.8) ––
Other (56.8) (35.1) (52.5)
Net cash used by investing activities (1,734.7) (1,313.5) (1,070.3)
38