Safeway 2006 Annual Report Download - page 80
Download and view the complete annual report
Please find page 80 of the 2006 Safeway annual report below. You can navigate through the pages in the report by either clicking on the pages listed below, or by using the keyword search tool below to find specific information within the annual report.-
 1
1 -
2
-
3
-
4
-
5
-
6
-
7
-
8
-
9
-
10
-
11
-
12
-
13
-
14
-
15
-
16
-
17
-
18
-
19
-
20
-
21
-
22
-
23
-
24
-
25
-
26
-
27
-
28
-
29
-
30
-
31
-
32
-
33
-
34
-
35
-
36
-
37
-
38
-
39
-
40
-
41
-
42
-
43
-
44
-
45
-
46
-
47
-
48
-
49
-
50
-
51
-
52
-
53
-
54
-
55
-
56
-
57
-
58
-
59
-
60
-
61
-
62
-
63
-
64
-
65
-
66
-
67
-
68
-
69
-
 70
70 -
 71
71 -
 72
72 -
 73
73 -
 74
74 -
 75
75 -
 76
76 -
 77
77 -
 78
78 -
 79
79 -
 80
80 -
 81
81 -
 82
82 -
 83
83 -
 84
84 -
 85
85 -
 86
86 -
 87
87 -
 88
88 -
 89
89 -
 90
90 -
91
-
92
-
93
 |
 |

SAFEWAY INC. AND SUBSIDIARIES
Notes to Consolidated Financial Statements
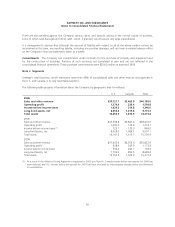
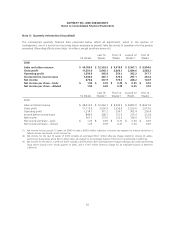
Note O: Quarterly Information (Unaudited)
The summarized quarterly financial data presented below reflect all adjustments, which in the opinion of
management, are of a normal and recurring nature necessary to present fairly the results of operations for the periods
presented. (Rounding affects some totals. In millions, except per-share amounts.)
52 Weeks
Last 16
Weeks
Third 12
Weeks
Second 12
Weeks (1)
First 12
Weeks
2006
Sales and other revenue $ 40,185.0 $ 12,503.5 $ 9,419.8 $ 9,367.1 $ 8,894.6
Gross profit 11,581.0 3,642.1 2,666.1 2,684.6 2,588.2
Operating profit 1,599.8 545.8 354.1 382.2 317.7
Income before income taxes 1,240.0 435.1 275.3 297.1 232.4
Net income 870.6 307.9 173.5 246.2 142.9
Net income per share – basic $ 1.96 $ 0.70 $ 0.39 $ 0.55 $ 0.32
Net income per share – diluted 1.94 0.69 0.39 0.55 0.32
52 Weeks
Last 16
Weeks (2)
Third 12
Weeks (3)
Second 12
Weeks
First 12
Weeks
2005
Sales and other revenue $ 38,416.0 $ 12,046.1 $ 8,945.5 $ 8,803.0 $ 8,621.4
Gross profit 11,112.9 3,506.9 2,556.6 2,529.9 2,519.5
Operating profit 1,214.7 377.2 239.7 302.4 295.4
Income before income taxes 849.0 268.1 151.9 216.4 212.8
Net income 561.1 173.5 122.5 134.0 131.3
Net income per share – basic $ 1.25 $ 0.39 $ 0.27 $ 0.30 $ 0.29
Net income per share – diluted 1.25 0.39 0.27 0.30 0.29
(1) Net income for the second 12 weeks of 2006 includes a $58.5 million reduction in income tax expense for interest earned on a
federal income tax refund, net of income tax.
(2) Net income for the last 16 weeks of 2005 includes an estimated $34.1 million after-tax charge related to closing 26 under-
performing Texas stores and a $23.0 million after-tax charge for an employee buyout in Dominick’s and Northern California.
(3) Net income for the third 12 weeks of 2005 includes a $33.9 million after-tax impairment charge relating to 26 under-performing
Texas stores closed in the fourth quarter of 2005, and a $13.6 million after-tax charge for an employee buyout in Northern
California.
62