Safeway 2006 Annual Report Download - page 4
Download and view the complete annual report
Please find page 4 of the 2006 Safeway annual report below. You can navigate through the pages in the report by either clicking on the pages listed below, or by using the keyword search tool below to find specific information within the annual report.-
 1
1 -
 2
2 -
 3
3 -
 4
4 -
 5
5 -
 6
6 -
 7
7 -
 8
8 -
 9
9 -
 10
10 -
 11
11 -
 12
12 -
 13
13 -
 14
14 -
 15
15 -
16
-
17
-
18
-
19
-
20
-
21
-
22
-
23
-
24
-
25
-
26
-
27
-
28
-
29
-
30
-
31
-
32
-
33
-
34
-
35
-
36
-
37
-
38
-
39
-
40
-
41
-
42
-
43
-
44
-
45
-
46
-
47
-
48
-
49
-
50
-
51
-
52
-
53
-
54
-
55
-
56
-
57
-
58
-
59
-
60
-
61
-
62
-
63
-
64
-
65
-
66
-
67
-
68
-
69
-
70
-
71
-
72
-
73
-
74
-
75
-
76
-
77
-
78
-
79
-
80
-
81
-
82
-
83
-
84
-
85
-
86
-
87
-
88
-
89
-
90
-
91
-
92
-
93
 |
 |

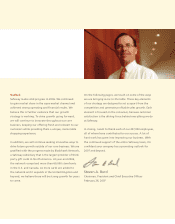
To our stockholders
By any measure, 2006 was another outstanding year for
Safeway. Building on the momentum of our dramatic
improvement in 2005, we achieved robust earnings
growth driven by strong sales gains and significant
operating and administrative expense leverage. As we
execute our strategy and satisfy our customers in 2007
and beyond, we are confident we can continue to build
on our success.
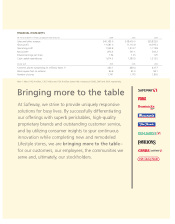
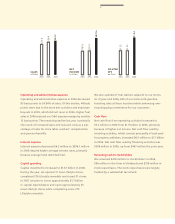
Results from operations
Net income was $870.6 million ($1.94 per diluted share)
in 2006 compared to $561.1 million ($1.25 per diluted
share) in 2005. Various tax items increased earnings in
2006 by $0.22 per diluted share. Earnings in 2005 were
reduced by a net $0.15 per diluted share for costs in-
curred for store exit activities and employee buyouts,
offset by the favorable resolution of various tax issues.
Sales
Total sales rose 4.6% to $40.2 billion in 2006 from $38.4
billion in 2005, primarily due to consistent execution of
our strategy, ongoing success of our Lifestyle stores and
increased fuel sales. Comparable-store sales climbed
4.4%, while identical-store sales (which do not include
replacement stores) were up 4.1%. Excluding fuel,
comparable-store sales and identical-store sales
increased 3.5% and 3.3%, respectively.
Lifestyle stores
With 751 Lifestyle stores in operation as of year-end
2006, they accounted for 43% of our total store base.
These stores contributed significantly to sales growth
throughout the year, and their aggregate return on
capital continues to exceed our investment hurdle rate.
Gross profit
Gross profit in 2006 decreased by a net 11 basis points
to 28.82% of sales. Higher fuel sales (which have a lower
gross margin) reduced gross profit by 28 basis points.
Excluding fuel, gross margin increased by 17 basis points
primarily because of better shrink control, benefits from
product-sourcing initiatives and improved product mix,
partly offset by targeted price investments and increased
advertising expense.