Safeway 2006 Annual Report Download - page 75
Download and view the complete annual report
Please find page 75 of the 2006 Safeway annual report below. You can navigate through the pages in the report by either clicking on the pages listed below, or by using the keyword search tool below to find specific information within the annual report.-
 1
1 -
2
-
3
-
4
-
5
-
6
-
7
-
8
-
9
-
10
-
11
-
12
-
13
-
14
-
15
-
16
-
17
-
18
-
19
-
20
-
21
-
22
-
23
-
24
-
25
-
26
-
27
-
28
-
29
-
30
-
31
-
32
-
33
-
34
-
35
-
36
-
37
-
38
-
39
-
40
-
41
-
42
-
43
-
44
-
45
-
46
-
47
-
48
-
49
-
50
-
51
-
52
-
53
-
54
-
55
-
56
-
57
-
58
-
59
-
60
-
61
-
62
-
63
-
64
-
 65
65 -
 66
66 -
 67
67 -
 68
68 -
 69
69 -
 70
70 -
 71
71 -
 72
72 -
 73
73 -
 74
74 -
 75
75 -
 76
76 -
 77
77 -
 78
78 -
 79
79 -
 80
80 -
 81
81 -
 82
82 -
 83
83 -
 84
84 -
 85
85 -
86
-
87
-
88
-
89
-
90
-
91
-
92
-
93
 |
 |

SAFEWAY INC. AND SUBSIDIARIES
Notes to Consolidated Financial Statements
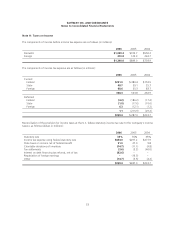
The following table provides the components of 2006, 2005 and 2004 net pension expense for the retirement plans
(in millions):
2006 2005 2004
Estimated return on assets $ 191.2 $ 167.8 $ 154.0
Service cost (101.1) (108.0) (109.9)
Interest cost (129.3) (125.5) (107.8)
Amortization of prior service cost (22.4) (16.8) (16.6)
Amortization of unrecognized losses (21.5) (33.1) (32.6)
Net pension expense $ (83.1) $(115.6) $(112.9)
Prior service costs are amortized on a straight-line basis over the average remaining service period of active
participants. Actuarial gains and losses are amortized over the average remaining service life of active participants
when the accumulation of such gains and losses exceeds 10% of the greater of the projected benefit obligation and
the fair value of plan assets. The Company uses its fiscal year-end date as the measurement date for its plans. The
accumulated benefit obligation for all Safeway plans was $2,011.4 million at year-end 2006 and $1,881.5 million at
year-end 2005.
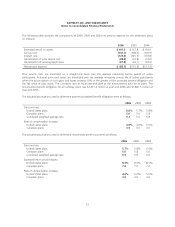
The actuarial assumptions used to determine year-end projected benefit obligation were as follows:
2006 2005 2004
Discount rate:
United States plans 6.0% 5.7% 5.8%
Canadian plans 5.0 5.0 5.8
Combined weighted-average rate 5.7 5.5 5.8
Rate of compensation increase:
United States plans 4.0% 4.0% 5.0%
Canadian plans 3.5 3.5 3.5
The actuarial assumptions used to determine net periodic benefit cost were as follows:
2006 2005 2004
Discount rate:
United States plans 5.7% 5.8% 6.0%
Canadian plans 5.0 5.8 6.0
Combined weighted-average rate 5.5 5.8 6.0
Expected return on plan assets:
United States plans 8.5% 8.5% 8.5%
Canadian plans 7.0 7.0 7.0
Rate of compensation increase:
United States plans 4.0% 5.0% 5.0%
Canadian plans 3.5 3.5 3.5
57