Verizon Wireless 2008 Annual Report Download - page 15
Download and view the complete annual report
Please find page 15 of the 2008 Verizon Wireless annual report below. You can navigate through the pages in the report by either clicking on the pages listed below, or by using the keyword search tool below to find specific information within the annual report.-
 1
1 -
2
-
3
-
4
-
 5
5 -
 6
6 -
 7
7 -
 8
8 -
 9
9 -
 10
10 -
 11
11 -
 12
12 -
 13
13 -
 14
14 -
 15
15 -
 16
16 -
 17
17 -
 18
18 -
 19
19 -
 20
20 -
 21
21 -
 22
22 -
 23
23 -
 24
24 -
 25
25 -
26
-
27
-
28
-
29
-
30
-
31
-
32
-
33
-
34
-
35
-
36
-
37
-
38
-
39
-
40
-
41
-
42
-
43
-
44
-
45
-
46
-
47
-
48
-
49
-
50
-
51
-
52
-
53
-
54
-
55
-
56
-
57
-
58
-
59
-
60
-
61
-
62
-
63
-
64
-
65
-
66
-
67
-
68
-
69
-
70
-
71
-
72
-
73
-
74
-
75
-
76
 |
 |

13
Selected Financial Data
VERIZON COMMUNICATIONS INC. AND SUBSIDIARIES
Verizon S&P 500 Telecom Services S&P 500
Stock Performance Graph
$0
$100
$80
$60
$20
$40
$140
$120
$200
$180
$160
2003 2004 2005 2006 2007 2008
Dollars
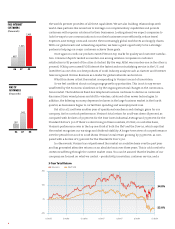
Comparison of Five-Year Total Return Among Verizon, S&P 500 Telecom Services Index and S&P 500 Stock Index
The graph compares the cumulative total returns of Verizon, the S&P 500 Telecommunications Services Index, and the S&P 500 Stock Index over a five-year period, adjusted for the spin-off of
our local exchange and related business assets in Maine, New Hampshire and Vermont and our domestic print and Internet yellow pages directories business. It assumes $100 was invested on
December 31, 2003, with dividends reinvested.
Data Points in Dollars
At December 31,
2003 2004 2005 2006 2007 2008
Verizon 100.0 120.2 93.7 126.0 153.9 126.1
S&P Telecom Services 100.0 119.9 113.5 155.0 173.4 120.6
S&P 500 100.0 110.9 116.3 134.7 142.1 89.5
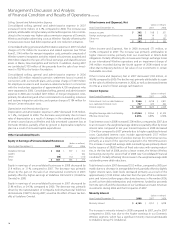
(dollars in millions, except per share amounts)
2008 2007 2006 2005 2004
Results of Operations
Operating revenues $97,354 $ 93,469 $ 88,182 $ 69,518 $ 65,751
Operating income 16,884 15,578 13,373 12,581 10,870
Income before discontinued operations, extraordinary item
and cumulative eect of accounting change 6,428 5,510 5,480 6,027 5,899
Per common share – basic 2.26 1.90 1.88 2.18 2.13
Per common share – diluted 2.26 1.90 1.88 2.16 2.11
Net income available to common shareowners 6,428 5,521 6,197 7,397 7,831
Per common share – basic 2.26 1.91 2.13 2.67 2.83
Per common share – diluted 2.26 1.90 2.12 2.65 2.79
Cash dividends declared per common share 1.78 1.67 1.62 1.62 1.54
Financial Position
Total assets $202,352 $ 186,959 $ 188,804 $ 168,130 $ 165,958
Debt maturing within one year 4,993 2,954 7,715 6,688 3,476
Long-term debt 46,959 28,203 28,646 31,569 34,970
Employee benet obligations 32,512 29,960 30,779 17,693 16,796
Minority interest 37,199 32,288 28,337 26,433 24,709
Shareowners’ investment 41,706 50,581 48,535 39,680 37,560
• Significanteventsaffectingourhistoricalearningstrendsin2006through2008aredescribedinManagement’sDiscussionandAnalysisofFinancialConditionandResultsofOperations.
• 2005dataincludessalesofbusiness,leaseimpairment,severance,pensionandbenefitchargesandotheritems.
• 2004dataincludessalesofbusiness,severance,pensionandbenefitchargesandotheritems.