Verizon Wireless 2008 Annual Report Download - page 19
Download and view the complete annual report
Please find page 19 of the 2008 Verizon Wireless annual report below. You can navigate through the pages in the report by either clicking on the pages listed below, or by using the keyword search tool below to find specific information within the annual report.-
 1
1 -
2
-
3
-
4
-
5
-
6
-
7
-
8
-
 9
9 -
 10
10 -
 11
11 -
 12
12 -
 13
13 -
 14
14 -
 15
15 -
 16
16 -
 17
17 -
 18
18 -
 19
19 -
 20
20 -
 21
21 -
 22
22 -
 23
23 -
 24
24 -
 25
25 -
 26
26 -
 27
27 -
 28
28 -
 29
29 -
30
-
31
-
32
-
33
-
34
-
35
-
36
-
37
-
38
-
39
-
40
-
41
-
42
-
43
-
44
-
45
-
46
-
47
-
48
-
49
-
50
-
51
-
52
-
53
-
54
-
55
-
56
-
57
-
58
-
59
-
60
-
61
-
62
-
63
-
64
-
65
-
66
-
67
-
68
-
69
-
70
-
71
-
72
-
73
-
74
-
75
-
76
 |
 |

Consolidated selling, general and administrative expense in 2008 included
$885 million for severance, pension and benefits charges (see “Other
Items”),$150millionformergerintegrationcosts,primarilycomprisedof
Wireline systems integration activities related to businesses acquired and
$87 million related to the spin-off of local exchange and related business
assets in Maine, New Hampshire and Vermont.
Consolidated selling, general and administrative expense in 2007 included
charges of $772 million for severance and related expenses (see “Other
Items”),$146millionformergerintegrationcosts,primarilycomprised
of Wireline systems integration activities related to businesses acquired
and $84 million related to the spin-off of local exchange and related
business assets in Maine, New Hampshire and Vermont. In addition,
during 2007 we contributed $100 million of the proceeds from the sale
ofourinvestmentinTelecomunicacionesdePuertoRico,Inc.(TELPRI)to
the Verizon Foundation.
Depreciation and Amortization Expense
Depreciation and amortization expense in 2008 increased $188 million,
or 1.3%, compared to 2007. The increase was mainly driven by growth in
depreciable telephone plant and non-network software from additional
capital spending.
2007 Compared to 2006
Cost of Services and Sales
Consolidated cost of services and sales expense in 2007 increased $2,238
million, or 6.3%, compared to 2006, primarily as a result of higher wireless
network costs and wireless equipment costs, as well as higher costs asso-
ciated with Wireline’s growth businesses. The increase was partially offset
by the impact of productivity improvement initiatives and decreases in
net pension and other postretirement benefit costs.
The higher wireless network costs were caused by increased network
usage relating to both voice and data services in 2007 compared to
2006, partially offset by decreased local interconnection, long distance
and roaming rates. Cost of wireless equipment sales increased in 2007
compared to 2006, primarily as a result of an increase in wireless devices
sold due to an increase in equipment upgrades.
Consolidated cost of services and sales expense in 2007 and 2006
included $32 million and $25 million, respectively, of costs associated
with the integration of MCI into our wireline business.
2008 Compared to 2007
Cost of Services and Sales
Cost of services and sales includes the following costs directly attribut-
able to a service or product: salaries and wages, benefits, materials and
supplies, contracted services, network access and transport costs, wire-
less equipment costs, customer provisioning costs, computer systems
support, costs to support our outsourcing contracts and technical facili-
ties and contributions to the universal service fund. Aggregate customer
care costs, which include billing and service provisioning, are allocated
between cost of services and sales and selling, general and administra-
tive expense.
Consolidated cost of services and sales in 2008 increased $1,460 mil-
lion, or 3.9%, compared to 2007, primarily as a result of higher wireless
network costs and wireless equipment costs. The increase was partially
offset by the impact of productivity improvement initiatives and lower
cost of services and sales driven by a decline in switched access lines
in service and wholesale voice connections. The higher wireless network
costs in 2008 were primarily caused by increased network usage for voice
and data services, increased roaming, increased use of data services and
applications and increased payments related to network leases. Cost of
wireless equipment sales increased in 2008 compared to 2007 primarily
as a result of an increase in the number of equipment upgrades by cus-
tomers, combined with an increase in average cost per unit. The increase
in cost of services and sales was also impacted by unfavorable foreign
exchange rates, higher utility costs and the inclusion of the results of
operations of a security services firm acquired on July 1, 2007.
Consolidated cost of services and sales in 2008 and 2007 include $24 mil-
lion and $32 million, respectively, of costs primarily associated with the
integration of MCI into our wireline business. Consolidated cost of ser-
vices and sales in 2008 also included $16 million related to the spin-off of
local exchange and related business assets in Maine, New Hampshire and
Vermont and $65 million for severance, pension and benefits charges.
Selling, General and Administrative Expense
Selling, general and administrative expense includes salaries and wages
and benefits not directly attributable to a service or product, bad debt
charges, taxes other than income taxes, advertising and sales commis-
sion costs, customer billing, call center and information technology costs,
professional service fees and rent for administrative space.
Consolidated selling, general and administrative expense in 2008
increased $931 million, or 3.6%, compared to 2007. The increase resulted
from higher sales commission expense, bad debt expense and adver-
tising and promotion costs, partially offset by lower salary and benefits
related expense and the impact of productivity initiatives.
17
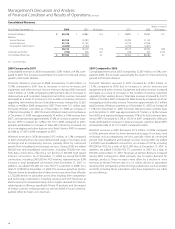
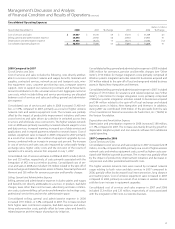
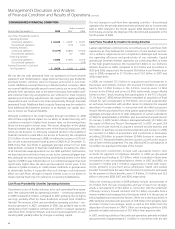
Consolidated Operating Expenses
(dollars in millions)
Years Ended December 31, 2008 2007 % Change 2007 2006 % Change
Cost of services and sales $ 39,007 $ 37,547 3.9 $ 37,547 $ 35,309 6.3
Selling, general and administrative expense 26,898 25,967 3.6 25,967 24,955 4.1
Depreciation and amortization expense 14,565 14,377 1.3 14,377 14,545 (1.2)
Consolidated Operating Expenses $ 80,470 $ 77,891 3.3 $ 77,891 $ 74,809 4.1
Management’s Discussion and Analysis
ofFinancialConditionandResultsofOperations continued