Verizon Wireless 2008 Annual Report Download - page 60
Download and view the complete annual report
Please find page 60 of the 2008 Verizon Wireless annual report below. You can navigate through the pages in the report by either clicking on the pages listed below, or by using the keyword search tool below to find specific information within the annual report.-
 1
1 -
2
-
3
-
4
-
5
-
6
-
7
-
8
-
9
-
10
-
11
-
12
-
13
-
14
-
15
-
16
-
17
-
18
-
19
-
20
-
21
-
22
-
23
-
24
-
25
-
26
-
27
-
28
-
29
-
30
-
31
-
32
-
33
-
34
-
35
-
36
-
37
-
38
-
39
-
40
-
41
-
42
-
43
-
44
-
45
-
46
-
47
-
48
-
49
-
 50
50 -
 51
51 -
 52
52 -
 53
53 -
 54
54 -
 55
55 -
 56
56 -
 57
57 -
 58
58 -
 59
59 -
 60
60 -
 61
61 -
 62
62 -
 63
63 -
 64
64 -
 65
65 -
 66
66 -
 67
67 -
 68
68 -
 69
69 -
 70
70 -
71
-
72
-
73
-
74
-
75
-
76
 |
 |

58
ties, we consider the risk remote and do not expect the settlement of
these transactions to have a material effect on our results of operations
or financial condition.
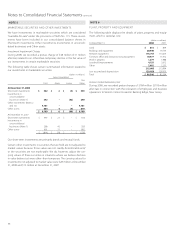
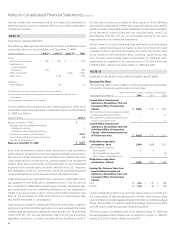
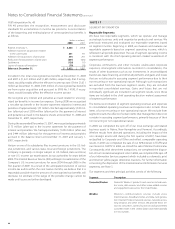
NOTE 12
FAIR VALUE MEASUREMENTS
The following table presents the balances of assets and liabilities mea-
sured at fair value on a recurring basis as of December 31, 2008:
(dollars in millions) Level 1(1) Level 2(2) Level 3
(3) Total
Assets:
Short-term investments $ 180 $ 329 $ – $ 509
Investments in
unconsolidated
businesses 290 – – 290
Other investments – – 4,781 4,781
Other assets – 1,158 – 1,158
Liabilities:
Other liabilities – 59 – 59
(1) quoted prices in active markets for identical assets or liabilities
(2) observable inputs other than quoted prices in active markets for identical assets
and liabilities
(3) no observable pricing inputs in the market
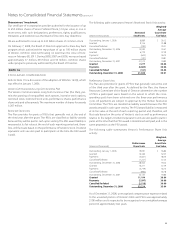
A reconciliation of the beginning and ending balance of items mea-
sured at fair value using significant unobservable inputs as of December
31, 2008 is as follows:
(dollars in millions) Level 3
Balance at January 1, 2008 $ –
Total gains (losses) (realized/unrealized):
Included in earnings –
Included in other comprehensive loss –
Purchases, issuances and settlements 4,767
Discount amortization included in earnings 14
Transfers in (out) of Level 3 –
Balance at December 31, 2008 $ 4,781
Short-term investments include a fund comprised of cash equivalents
held in trust for the payment of certain employee benefits and are classi-
fied as Level 2. These temporary cash investments are stated at fair value
using matrix pricing as they are not actively traded in an established
market. Short-term investments and Investments in unconsolidated
businesses also include equity securities, mutual funds, U.S. Treasuries,
and obligations of the U.S. government, which are generally measured
using quoted prices in active markets and are classified as Level 1.
Other investments are comprised of our investment in Alltel debt, which
was acquired in June 2008, and is classified as Level 3. The fair value of
the investment in Alltel debt is based upon internally developed valu-
ation techniques since the underlying obligations are not registered or
traded in an active market. Upon closing of the Alltel acquisition (see
Note 2), the investment in Alltel debt became an intercompany loan
that will be eliminated in consolidation.
Other assets are primarily comprised of domestic and foreign corporate
and government bonds. While quoted prices in active markets for certain
of these debt securities are available, for some they are not. As permitted
under SFAS No. 157, we use alternative matrix pricing as a practical
expedient resulting in our debt securities being classified as Level 2.
Notes to Consolidated Financial Statements continued
Our derivative contracts, included in Other assets or Other liabilities,
are primarily comprised of interest rate swaps, are valued using models
based on readily observable market parameters for all substantial terms
of our derivative contracts and thus are classified within Level 2. As
permitted by SFAS No. 157, we use mid-market pricing for fair value
measurements of our derivative instruments.
The fair value of our short-term and long-term debt, excluding capital
leases, is determined based on market quotes for similar terms and
maturities or future cash flows discounted at current rates. The fair value
of our long-term and short-term debt, excluding capital leases, was
$53,174 million and $32,380 million at December 31, 2008 and 2007,
respectively, as compared to the carrying value of $51,562 million and
$30,845 million, respectively at December 31, 2008 and 2007.
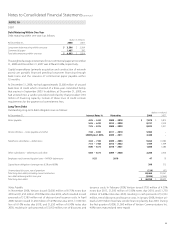
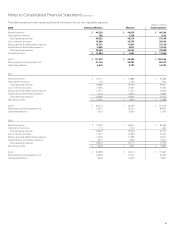
NOTE 13
EARNINGS PER SHARE AND SHAREOWNERS’ INVESTMENT
Earnings Per Share
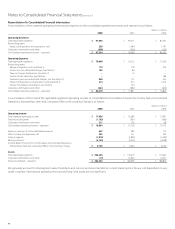
The following table is a reconciliation of the numerators and denomina-
tors used in computing earnings per common share:
(dollars and shares in millions, except per share amounts)
Years Ended December 31, 2008 2007 2006
Income Before Discontinued
Operations, Extraordinary Item and
Cumulative Eect of Accounting
Change $ 6,428 $ 5,510 $ 5,480
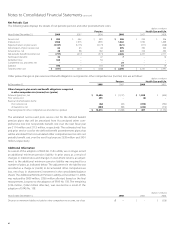
After-tax minority interest expense related
to exchangeable equity interest –– 20
After-tax interest expense related to zero-
coupon convertible notes –– 11
Income Before Discontinued
Operations, Extraordinary Item and
Cumulative Eect of Accounting
Change – after assumed conversion
of dilutive securities $ 6,428 $ 5,510 $ 5,511
Weighted-average shares
outstanding – basic 2,849 2,898 2,912
Eect of dilutive securities:
Stock options 14 1
Exchangeable equity interest –– 18
Zero-coupon convertible notes –– 7
Weighted-average shares
outstanding – diluted 2,850 2,902 2,938
Earnings Per Common Share from
Income Before Discontinued
Operations, Extraordinary Item and
Cumulative Eect of Accounting
Change
Basic $ 2.26 $ 1.90 $ 1.88
Diluted $ 2.26 $ 1.90 $ 1.88
Certain outstanding options to purchase shares were not included in
the computation of diluted earnings per common share because they
were not dilutive, including approximately 158 million weighted-average
shares during 2008, 170 million weighted-average shares during 2007
and 228 million weighted-average shares during 2006.
The zero-coupon convertible notes were retired on May 15, 2006 and
the exchangeable equity interest was converted on August 15, 2006 by
issuing 29.5 million Verizon shares (see Note 8).