Verizon Wireless 2008 Annual Report Download - page 16
Download and view the complete annual report
Please find page 16 of the 2008 Verizon Wireless annual report below. You can navigate through the pages in the report by either clicking on the pages listed below, or by using the keyword search tool below to find specific information within the annual report.-
 1
1 -
2
-
3
-
4
-
5
-
 6
6 -
 7
7 -
 8
8 -
 9
9 -
 10
10 -
 11
11 -
 12
12 -
 13
13 -
 14
14 -
 15
15 -
 16
16 -
 17
17 -
 18
18 -
 19
19 -
 20
20 -
 21
21 -
 22
22 -
 23
23 -
 24
24 -
 25
25 -
 26
26 -
27
-
28
-
29
-
30
-
31
-
32
-
33
-
34
-
35
-
36
-
37
-
38
-
39
-
40
-
41
-
42
-
43
-
44
-
45
-
46
-
47
-
48
-
49
-
50
-
51
-
52
-
53
-
54
-
55
-
56
-
57
-
58
-
59
-
60
-
61
-
62
-
63
-
64
-
65
-
66
-
67
-
68
-
69
-
70
-
71
-
72
-
73
-
74
-
75
-
76
 |
 |

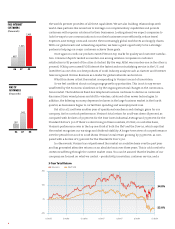
Revenue Growth – To generate revenue growth we are devoting our
resources to higher growth markets such as the wireless voice and data
markets, the broadband and video markets, and the provision of stra-
tegic services to business markets, rather than to the traditional wireline
voice market. During 2008, revenues from these higher growth markets
offset continuing declines in the traditional voice mass market, and we
reported consolidated revenue growth of 4.2%. We continue developing
and marketing innovative product bundles to include local, long-distance,
wireless and broadband services for consumer and general business retail
customers. We anticipate that these efforts will help counter the effects of
competition and technology substitution that have resulted in access line
losses, and will enable us to continue to grow consolidated revenues.
Market Share Gains – In our wireless business, our goal is to be the market
leader in providing wireless voice and data communication services in
the United States. To gain market share, we are focused on providing the
highest network reliability and new and innovative products and services
such as Mobile Broadband and our Evolution-Data Optimized (EV-
DO) service. We also continue to expand our wireless data, messaging
and multi-media offerings for both consumer and business customers.
During 2008,
• our total number of customers increased 9.7% to 72.1 million; and
• averagerevenuepercustomer per month(ARPU) from service reve-
nues increased by 1.2% to $51.59 from increased use of our messaging
and other data services.
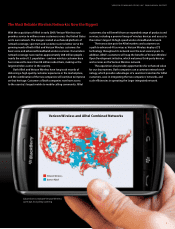
With our acquisition of Alltel Corporation (Alltel) in January 2009, we
became the largest wireless provider in the U.S. as measured by the total
number of customers.
In our wireline business, our goal is to become the leading broadband
provider in every market in which we operate. During 2008,
• we passed 12.7 million premises with our high-capacity fiber optics
network operated under the FiOS service mark;
• we added 660,000 net wireline broadband connections, for a total of
8,673,000 connections; and
• we added approximately 975,000 net new FiOS TV customers, for a
total of 1,918,000 FiOS TV customers.
With FiOS, we have created the opportunity to increase revenue per
customer as well as improve retention and profitability as the traditional
fixed-line telephone business continues to decline as customers migrate
to wireless, cable and other newer technologies. We are also focused on
gaining market share in the enterprise business by the deployment of
strategic service offerings – including expansion of our VoIP and inter-
national Ethernet capabilities, the introduction of video and web-based
conferencing capabilities, and enhancements to our virtual private net-
work portfolio. In 2008, revenues from strategic services grew 16.1%.
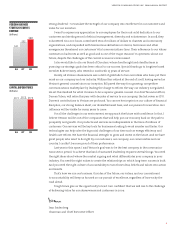
Profitability Improvement – Our goal is to increase operating income
and margins. In 2008,
• operating income rose 8.4% compared to 2007;
• income before provision for income taxes, discontinued operations
and extraordinary item rose 2.8% compared to 2007; and
• operating income margin rose 4% to 17.3% compared to 2007.
To position our company for sustainable, long-term profitability, we are
directing our capital spending primarily toward higher growth markets.
High-speed wireless data services, fiber optics to the premises, as well
as expanded services to enterprise customers, are examples of these
growth markets. During 2008, capital expenditures were $17,238 million
compared with capital expenditures of $17,538 million in 2007, excluding
OVERVIEW
Verizon Communications Inc., (Verizon or the Company) is one of the
world’s leading providers of communications services. Our domestic
wireless business, operating as Verizon Wireless, provides wireless voice
and data products and services across the United States (U.S.) using one
of the most extensive and reliable wireless networks. Our wireline busi-
ness provides communications services, including voice, broadband
data and video services, network access, nationwide long-distance and
other communications products and services, and also owns and oper-
ates one of the most expansive end-to-end global Internet Protocol (IP)
networks. Stressing diversity and commitment to the communities in
which we operate, we have a highly diverse workforce of approximately
223,900 employees.
In the sections that follow we provide information about the important
aspects of our operations and investments, both at the consolidated and
segment levels, and discuss our results of operations, financial position
and sources and uses of cash. In addition, we highlight key trends and
uncertainties to the extent practicable. The content and organization of
the financial and non-financial data presented in these sections are con-
sistent with information used by our chief operating decision makers for,
among other purposes, evaluating performance and allocating resources.
We also monitor several key economic indicators as well as the state of
the economy in general, primarily in the United States where the majority
of our operations are located, in evaluating our operating results and
assessing the potential impacts of these trends on our businesses. While
most key economic indicators, including gross domestic product, affect
our operations to some degree, we historically have noted higher cor-
relations to non-farm employment, personal consumption expenditures
and capital spending, as well as more general economic indicators such
as inflationary or recessionary trends and housing starts.
Our results of operations, financial position and sources and uses of cash
in the current and future periods reflect our focus on the following stra-
tegic imperatives:
14
Management’s Discussion and Analysis
ofFinancialConditionandResultsofOperations
VERIZON COMMUNICATIONS INC. AND SUBSIDIARIES