Verizon Wireless 2008 Annual Report Download - page 26
Download and view the complete annual report
Please find page 26 of the 2008 Verizon Wireless annual report below. You can navigate through the pages in the report by either clicking on the pages listed below, or by using the keyword search tool below to find specific information within the annual report.-
 1
1 -
2
-
3
-
4
-
5
-
6
-
7
-
8
-
9
-
10
-
11
-
12
-
13
-
14
-
15
-
 16
16 -
 17
17 -
 18
18 -
 19
19 -
 20
20 -
 21
21 -
 22
22 -
 23
23 -
 24
24 -
 25
25 -
 26
26 -
 27
27 -
 28
28 -
 29
29 -
 30
30 -
 31
31 -
 32
32 -
 33
33 -
 34
34 -
 35
35 -
 36
36 -
37
-
38
-
39
-
40
-
41
-
42
-
43
-
44
-
45
-
46
-
47
-
48
-
49
-
50
-
51
-
52
-
53
-
54
-
55
-
56
-
57
-
58
-
59
-
60
-
61
-
62
-
63
-
64
-
65
-
66
-
67
-
68
-
69
-
70
-
71
-
72
-
73
-
74
-
75
-
76
 |
 |

24
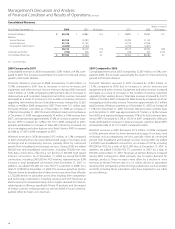
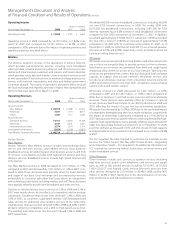
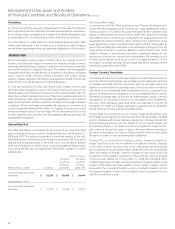
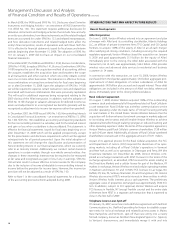
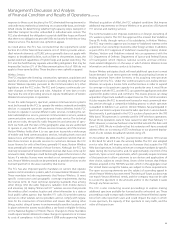
CONSOLIDATED FINANCIAL CONDITION
(dollars in millions)
Years Ended December 31, 2008 2007 2006
Cash Flows Provided By (Used In)
Operating Activities:
Continuing operations $ 26,620 $ 26,309 $ 23,030
Discontinued operations –(570) 1,076
Investing Activities:
Continuing operations (31,579) (16,865) (17,422)
Discontinued operations –757 1,806
Financing activities:
Continuing operations 13,588 (11,697) (5,752)
Discontinued operations –– (279)
Increase (Decrease) In Cash and
Cash Equivalents $ 8,629 $ (2,066) $ 2,459
We use the net cash generated from our operations to fund network
expansion and modernization, repay external financing, pay dividends,
purchase Verizon common stock for treasury and invest in new busi-
nesses. Additional external financing is obtained when necessary. While
our current liabilities typically exceed current assets, our sources of funds,
primarily from operations and, to the extent necessary, from readily avail-
able external financing arrangements, are sufficient to meet ongoing
operating and investing requirements. We expect that capital spending
requirements will continue to be financed primarily through internally
generated funds. Additional debt or equity financing may be needed to
fund additional development activities or to maintain our capital struc-
ture to ensure our financial flexibility.
Although conditions in the credit markets through December 31, 2008
did not have a significant impact on our ability to obtain financing, such
conditions resulted in higher fixed interest rates on borrowings than
those we have paid in recent years. The recent disruption in the global
financial markets has also affected some of the financial institutions with
which we do business. A continuing sustained decline in the stability of
financial institutions could affect our access to financing. We completed
$21.9 billion of new financing in 2008, including the issuance of $9.2 bil-
lion of new notes during the fourth quarter of 2008. As of December 31,
2008, more than two-thirds in aggregate principal amount of our total
debt portfolio consisted of fixed rate indebtedness (including the effect
of all interest rate swap agreements on our debt portfolio). Furthermore,
we have had, and continue to have, access to the commercial paper mar-
kets, although we were required during a brief period of time in the third
quarter of 2008 to pay interest rates on our commercial paper that were
significantly higher than the rates we have paid in recent years. If the
national or global economy or credit market conditions in general were
to deteriorate further, it is possible that such changes could adversely
affect our cash flows through increased interest costs or our ability to
obtain external financing or to refinance our existing indebtedness.
Cash Flows Provided By (Used In) Operating Activities
Our primary source of funds continues to be cash generated from opera-
tions. Net cash provided by operating activities – continuing operations
in 2008 increased $0.3 billion, compared to 2007, primarily due to higher
earnings, partially offset by lower dividends received from Vodafone
Omnitel. The increase in Net cash provided by operating activities – con-
tinuing operations in 2007, compared to 2006, was primarily due to the
distributions from Vodafone Omnitel and CANTV, increased operating
cash flows from Domestic Wireless and lower interest payments on out-
standing debt, partially offset by changes in working capital.
The net changes in cash flow from operating activities – discontinued
operations for the periods presented were primarily due to income taxes
paid in 2007 related to the fourth quarter 2006 disposition of Verizon
Dominicana, as well as the disposal of the discontinued operations in the
fourth quarter of 2006.
Cash Flows Provided By (Used In) Investing Activities
Capital expenditures continue to be our primary use of cash flows from
operations, as they facilitate the introduction of new products and ser-
vices, enhance responsiveness to competitive challenges and increase
the operating efficiency and productivity of our networks. Capital
spending at Domestic Wireless represents our continuing effort to invest
in this high growth business. We invested $6.5 billion in our Domestic
Wireless business in 2008, compared to $6.5 billion and $6.6 billion in
2007 and 2006, respectively. We invested $9.8 billion in our Wireline busi-
ness in 2008, compared to $11.0 billion and $10.3 billion in 2007 and
2006, respectively.
In 2008, we invested $15.9 billion in acquisitions and investments in
businesses and wireless licenses. We invested $9.4 billion to acquire
twenty-five 12 MHz licenses in the A block, seventy-seven 12 MHz
licenses in the B Block and seven 22 MHz (nationwide, except Alaska)
licenses in the C block resulting from participation in the FCC’s Auction
73.OnAugust7,2008,VerizonWirelesscompleteditsacquisitionofRural
Cellular for cash consideration of $0.9 billion, net of cash acquired after
an exchange transaction with another carrier to complete the required
divestiture of certain markets. In connection with the Alltel transaction,
Verizon Wireless purchased from third parties approximately $5.0 billion
aggregate principal amount of debt obligations of certain subsidiaries
of Alltel for approximately $4.8 billion plus accrued and unpaid interest.
On January 9, 2009, Verizon Wireless paid approximately $5.9 billion for
theequityofAlltel(see“RecentDevelopments”).In2007,wepaid$0.4
billion, net of cash received, to acquire a network security business and
$0.2 billion to purchase several wireless properties and licenses. In 2006,
we invested $1.4 billion in acquisitions and investments in businesses,
including $2.8 billion to acquire thirteen 20 MHz licenses in connection
with the FCC Advanced Wireless Services auction, as well as the acquisi-
tion of other wireless properties. This was offset by MCI’s cash balances of
$2.4 billion we acquired at the date of the merger.
Our short-term investments include cash equivalents held in trust
accounts for payment of employee benefits. In 2008, we decreased
our annual trust funding to $0.1 billion, which is included in Short-term
investments in the consolidated balance sheets. In 2007 and 2006, we
invested $1.7 billion and $1.9 billion, respectively, in short-term invest-
ments, primarily to pre-fund active employees’ health and welfare
benefits. Proceeds from the sales of all short-term investments, principally
for the payment of these benefits, were $1.8 billion, $1.9 billion and $2.2
billion in the years 2008, 2007 and 2006, respectively.
Other, net investing activities in 2008 primarily include cash proceeds of
$0.3 billion from the sale of properties and sale of select non-strategic
assets, a cash payment of $0.2 billion in connection with the settlement
of foreign currency forward contracts and $0.1 billion receivable from a
money market fund managed by a third party, which is in the process of
being liquidated and returned to Verizon. Other, net investing activities in
2007 primarily included cash proceeds of $0.8 billion from property sales
and sales of select non-strategic assets, as well as $0.5 billion from the
disposition of our interest in CANTV. Other, net investing activities in 2006
primarily included cash proceeds of $0.3 billion from property sales.
In 2007, investing activities of discontinued operations primarily included
gross proceeds of approximately $1.0 billion in connection with the sale
Management’s Discussion and Analysis
ofFinancialConditionandResultsofOperations continued