Verizon Wireless 2008 Annual Report Download - page 54
Download and view the complete annual report
Please find page 54 of the 2008 Verizon Wireless annual report below. You can navigate through the pages in the report by either clicking on the pages listed below, or by using the keyword search tool below to find specific information within the annual report.-
 1
1 -
2
-
3
-
4
-
5
-
6
-
7
-
8
-
9
-
10
-
11
-
12
-
13
-
14
-
15
-
16
-
17
-
18
-
19
-
20
-
21
-
22
-
23
-
24
-
25
-
26
-
27
-
28
-
29
-
30
-
31
-
32
-
33
-
34
-
35
-
36
-
37
-
38
-
39
-
40
-
41
-
42
-
43
-
 44
44 -
 45
45 -
 46
46 -
 47
47 -
 48
48 -
 49
49 -
 50
50 -
 51
51 -
 52
52 -
 53
53 -
 54
54 -
 55
55 -
 56
56 -
 57
57 -
 58
58 -
 59
59 -
 60
60 -
 61
61 -
 62
62 -
 63
63 -
 64
64 -
65
-
66
-
67
-
68
-
69
-
70
-
71
-
72
-
73
-
74
-
75
-
76
 |
 |

52
Notes to Consolidated Financial Statements continued
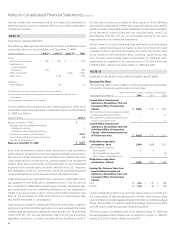
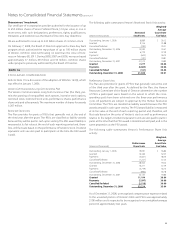
NOTE 5
MARKETABLE SECURITIES AND OTHER INVESTMENTS
We have investments in marketable securities which are considered
“available-for-sale” under the provisions of SFAS No. 115. These invest-
ments have been included in our consolidated balance sheets in
Short-term investments, Other investments, Investments in unconsoli-
dated businesses and Other assets.
Investment Impairment Charge
During 2008, we recorded a pretax charge of $48 million ($31 million
after-tax) related to an other-than-temporary decline in the fair value of
our investments in certain marketable securities.
The following table shows certain summarized information related to
our investments in marketable securities:
(dollars in millions)
Gross Unrealized
Cost Gains Losses
Fair
Value
At December 31, 2008
Short-term investments $ 362 $ 2 $ (5) $ 359
Investments in
unconsolidated
businesses (Note 7) 342 – (52) 290
Other investments (Notes 2
and 12) 4,781 – – 4,781
Other assets 684 4 (9) 679
$ 6,169 $ 6 $ (66) $ 6,109
At December 31, 2007
Short-term investments $ 497 $ 21 $ – $ 518
Investments in
unconsolidated
businesses (Note 7) 286 42 – 328
Other assets 661 31 – 692
$ 1,444 $ 94 $ – $ 1,538
Our short-term investments are primarily bonds and mutual funds.
Certain other investments in securities that we hold are not adjusted to
market values because those values are not readily determinable and/
or the securities are not marketable. We do, however, adjust the car-
rying values of these securities in situations where we believe declines
in value below cost were other–than-temporary. The carrying values for
investments not adjusted to market value were $28 million at December
31, 2008 and $15 million at December 31, 2007.
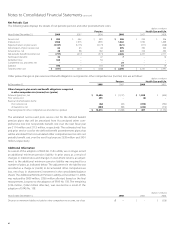
NOTE 6
PLANT, PROPERTY AND EQUIPMENT
The following table displays the details of plant, property and equip-
ment, which is stated at cost:
(dollars in millions)
At December 31, 2008 2007
Land $ 815 $ 839
Buildings and equipment 20,440 19,734
Network equipment 175,757 173,654
Furniture, oce and data processing equipment 10,477 11,912
Work in progress 1,279 1,988
Leasehold improvements 4,155 3,612
Other 2,682 2,255
215,605 213,994
Less accumulated depreciation 129,059 128,700
Total $ 86,546 $ 85,294
Verizon Center Relocation, Net
During 2006, we recorded pretax charges of $184 million ($118 million
after-tax) in connection with the relocation of employees and business
operations to Verizon Center located in Basking Ridge, New Jersey.