Verizon Wireless 2008 Annual Report Download - page 21
Download and view the complete annual report
Please find page 21 of the 2008 Verizon Wireless annual report below. You can navigate through the pages in the report by either clicking on the pages listed below, or by using the keyword search tool below to find specific information within the annual report.-
 1
1 -
2
-
3
-
4
-
5
-
6
-
7
-
8
-
9
-
10
-
 11
11 -
 12
12 -
 13
13 -
 14
14 -
 15
15 -
 16
16 -
 17
17 -
 18
18 -
 19
19 -
 20
20 -
 21
21 -
 22
22 -
 23
23 -
 24
24 -
 25
25 -
 26
26 -
 27
27 -
 28
28 -
 29
29 -
 30
30 -
 31
31 -
32
-
33
-
34
-
35
-
36
-
37
-
38
-
39
-
40
-
41
-
42
-
43
-
44
-
45
-
46
-
47
-
48
-
49
-
50
-
51
-
52
-
53
-
54
-
55
-
56
-
57
-
58
-
59
-
60
-
61
-
62
-
63
-
64
-
65
-
66
-
67
-
68
-
69
-
70
-
71
-
72
-
73
-
74
-
75
-
76
 |
 |

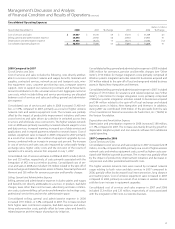
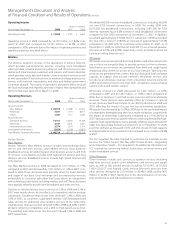
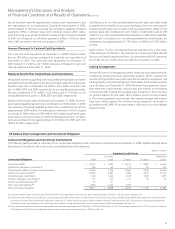
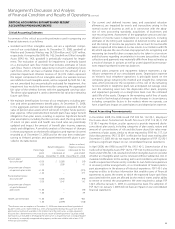
Provision for Income Taxes
(dollars in millions)
Years Ended December 31, 2008 2007 2006
Provision for income taxes $ 3,331 $ 3,982 $ 2,674
Eective income tax rate 34.1% 42.0% 32.8%
The effective income tax rate is the provision for income taxes as a per-
centage of income from continuing operations before the provision for
income taxes. The effective income tax rate in 2008 was lower than 2007
primarily due to recording $610 million of foreign and domestic taxes and
expenses in 2007 specifically relating to our share of Vodafone Omnitel’s
distributable earnings. Verizon received net distributions from Vodafone
Omnitel in April 2008 and December 2007 of approximately $670 million
and $2,100 million, respectively.
The effective income tax rate in 2007 compared to 2006 was higher
primarily due to taxes recorded in 2007 related to distributions from
Vodafone Omnitel as discussed above. The 2007 rate was also increased
due to higher state taxes in 2007 as compared to 2006, as well as greater
benefits from foreign operations in 2006 compared to 2007. These
increases were partially offset by lower expenses recorded for unrecog-
nized tax benefits in 2007 as compared to 2006.
A reconciliation of the statutory federal income tax rate to the effective
income tax rate for each period is included in Note 16 to the consoli-
dated financial statements.
Discontinued Operations
In accordance with Statement of Financial Accounting Standard (SFAS)
No. 144, Accounting for the Impairment or Disposal of Long-Lived Assets, we
haveclassifiedTELPRI,VerizonDominicanaandourformerdomesticprint
and Internet yellow pages directories publishing operations as discon-
tinued operations in the consolidated financial statements for all periods
presented through the date of the divestiture or spin-off.
On March 30, 2007, after receiving Federal Communications Commission
(FCC)approval,wecompletedthesaleofour52%interestinTELPRIand
received gross proceeds of approximately $980 million. The sale resulted
in a pretax gain of $120 million ($70 million after-tax, or $.02 per diluted
share). Additionally, $100 million of the proceeds were contributed to the
Verizon Foundation.
The sale of Verizon Dominicana closed in December 2006, and primarily
due to taxes on previously unremitted earnings, a pretax gain of $30 mil-
lion resulted in an after-tax loss of $541 million ($.18 per diluted share).
We completed the spin-off of our domestic print and Internet yellow
pages directories business to our shareowners on November 17, 2006,
which resulted in an $8,695 million increase to contributed capital in
shareowner’s investment. In addition, we recorded pretax charges of
$117 million ($101 million after-tax, or $.03 per diluted share) for costs
related to this spin-off. These costs primarily consisted of debt retirement
costs, costs associated with accumulated vested benefits of employees,
investment banking fees and other transaction costs related to the spin-
off, which are included in discontinued operations.
Income from discontinued operations, net of tax, decreased by $617
million, or 81.3%, in 2007 compared to 2006. The decrease was primarily
driven by the assets disposed of in 2006, partially offset by the after-tax
gainrecordedin2007onthesaleofourinvestmentinTELPRI.
19
Management’s Discussion and Analysis
ofFinancialConditionandResultsofOperations continued
Extraordinary Item
In January 2007,theBolivarianRepublicofVenezuela(theRepublic)
declared its intent to nationalize certain companies, including CANTV. On
February 12, 2007, we entered into a Memorandum of Understanding
(MOU)withtheRepublic,whichprovidedthattheRepublicoffertopur-
chase all of the equity securities of CANTV, including our 28.5% interest,
through public tender offers in Venezuela and the United States. Under
the terms of the MOU, the prices in the tender offers would be adjusted
downward to reflect any dividends declared and paid subsequent to
February 12, 2007. During 2007, the tender offers were completed and
Verizon received an aggregate amount of approximately $572 million,
which included $476 million from the tender offers as well as $96 million
of dividends declared and paid subsequent to the MOU. During 2007,
based upon our investment balance in CANTV, we recorded an extraor-
dinary loss of $131 million, including taxes of $38 million, or $.05 per
diluted share.
Cumulative Effect of Accounting Change
Effective January 1, 2006, we adopted SFAS No. 123(R), Share-Based
Payments, utilizing the modified prospective method. The impact to
Verizon primarily resulted from Domestic Wireless, for which we recorded
a $42 million ($.01 per diluted share) cumulative effect of accounting
change, net of taxes and after minority interest, to recognize the effect of
initially measuring the outstanding liability for awards granted to Domestic
Wireless employees at fair value utilizing a Black-Scholes model.
SEGMENT RESULTS OF OPERATIONS
We have two reportable segments, Domestic Wireless and Wireline, which
we operate and manage as strategic business units and organize by prod-
ucts and services. We previously measured and evaluated our reportable
segments based on segment income. Beginning in 2008, we measure
and evaluate our reportable segments based on segment operating
income, which is reflected in all periods presented. The use of segment
operating income is consistent with the chief operating decision makers’
assessment of segment performance. You can find additional information
about our segments in Note 17 to the consolidated financial statements.
Corporate, eliminations and other includes unallocated corporate
expenses, intersegment eliminations recorded in consolidation, the results
of other businesses such as our investments in unconsolidated businesses,
lease financing, and other adjustments and gains and losses that are not
allocated in assessing segment performance due to their non-recurring
or non-operational nature. Although such transactions are excluded from
the business segment results, they are included in reported consolidated
earnings. Gains and losses that are not individually significant are included
in all segment results, since these items are included in the chief oper-
ating decision makers’ assessment of segment performance.