Verizon Wireless 2008 Annual Report Download - page 2
Download and view the complete annual report
Please find page 2 of the 2008 Verizon Wireless annual report below. You can navigate through the pages in the report by either clicking on the pages listed below, or by using the keyword search tool below to find specific information within the annual report.-
 1
1 -
 2
2 -
 3
3 -
 4
4 -
 5
5 -
 6
6 -
 7
7 -
 8
8 -
 9
9 -
 10
10 -
 11
11 -
 12
12 -
 13
13 -
14
-
15
-
16
-
17
-
18
-
19
-
20
-
21
-
22
-
23
-
24
-
25
-
26
-
27
-
28
-
29
-
30
-
31
-
32
-
33
-
34
-
35
-
36
-
37
-
38
-
39
-
40
-
41
-
42
-
43
-
44
-
45
-
46
-
47
-
48
-
49
-
50
-
51
-
52
-
53
-
54
-
55
-
56
-
57
-
58
-
59
-
60
-
61
-
62
-
63
-
64
-
65
-
66
-
67
-
68
-
69
-
70
-
71
-
72
-
73
-
74
-
75
-
76
 |
 |

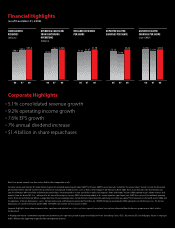
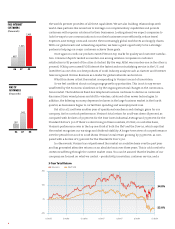
Financial Highlights
(as of December 31, 2008)
$2.54 $2.54
$2.39
$2.26
$2.12
$1.90
$88.2 $93.5 $97.4
$23.0
$26.3 $26.6 $1.67
$1.62
$1.78
ADJUSTED DILUTED
EARNINGS PER SHARE
(non-GAAP)
06 07 0806 07 08
REPORTED DILUTED
EARNINGS PER SHARE
CONSOLIDATED
REVENUES
(billions)
OPERATING CASH FLOW
FROM CONTINUING
OPERATIONS
(billions)
DECLARED DIVIDENDS
PER SHARE
06 07 08 06 07 08 06 07 08
Note: Prior-period amounts have been reclassified to reflect comparable results.
See www.verizon.com/investor for reconciliations to generally accepted accounting principles (GAAP) for the non-GAAP financial measures included in this annual report. Verizon’s results for the periods
presented have been adjusted to reflect the spinoff of local exchange and related business assets in Maine, New Hampshire and Vermont in March 2008. These reclassifications were determined using
specific information where available and allocations where data is not maintained on a state-specific basis within the Company’s books and records. Verizon’s 2006 reported results include revenues and
expenses from the former MCI, Inc., subsequent to the close of the merger in January 2006. Information provided in this annual report on a pro-forma (non-GAAP) basis presents the combined operating
results of Verizon and the former MCI on a comparable basis. Discontinued operations include Verizon’s former directory publishing unit, which was spun off to shareowners in the fourth quarter 2006, and
the operations of Verizon Dominicana C. por A. (Verizon Dominciana) and Telecomunicaciones de Puerto Rico Inc. (TELPRI) following second quarter 2006 agreements to sell the businesses. The Verizon
Dominicana sale closed in the fourth quarter 2006. The TELPRI sale closed in the first quarter of 2007.
Corporate Highlights shown above are presented on a pro forma and adjusted basis. Intra- and inter-segment transactions have not been eliminated from the business group revenue totals cited in
this document.
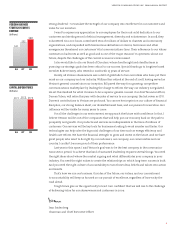
In keeping with Verizon’s commitment to protect the environment, this report was printed on paper certified by the Forest Stewardship Council (FSC). By selecting FSC-certified paper, Verizon is helping to
make a difference by supporting responsible forest management practices.
Corporate Highlights
> 5.1% consolidated revenue growth
> 9.2% operating income growth
> 7.6% EPS growth
> 7% annual dividend increase
> $1.4 billion in share repurchases