Verizon Wireless 2008 Annual Report Download - page 22
Download and view the complete annual report
Please find page 22 of the 2008 Verizon Wireless annual report below. You can navigate through the pages in the report by either clicking on the pages listed below, or by using the keyword search tool below to find specific information within the annual report.-
 1
1 -
2
-
3
-
4
-
5
-
6
-
7
-
8
-
9
-
10
-
11
-
 12
12 -
 13
13 -
 14
14 -
 15
15 -
 16
16 -
 17
17 -
 18
18 -
 19
19 -
 20
20 -
 21
21 -
 22
22 -
 23
23 -
 24
24 -
 25
25 -
 26
26 -
 27
27 -
 28
28 -
 29
29 -
 30
30 -
 31
31 -
 32
32 -
33
-
34
-
35
-
36
-
37
-
38
-
39
-
40
-
41
-
42
-
43
-
44
-
45
-
46
-
47
-
48
-
49
-
50
-
51
-
52
-
53
-
54
-
55
-
56
-
57
-
58
-
59
-
60
-
61
-
62
-
63
-
64
-
65
-
66
-
67
-
68
-
69
-
70
-
71
-
72
-
73
-
74
-
75
-
76
 |
 |

20
Domestic Wireless
Our Domestic Wireless segment provides wireless voice and data ser-
vices, other value-added services and equipment sales across the United
States. This segment primarily represents the operations of our joint ven-
ture with Vodafone, operating as Verizon Wireless. We own a 55% interest
in the joint venture and Vodafone owns the remaining 45%. All financial
results included in the tables below reflect the consolidated results of
Verizon Wireless.
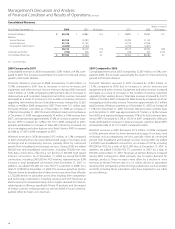
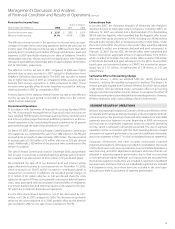
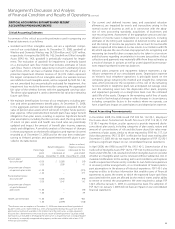
Operating Revenue
(dollars in millions)
Years Ended December 31, 2008 2007 2006
Service revenue $ 42,635 $ 38,016 $ 32,796
Equipment and other 6,697 5,866 5,247
Total Domestic Wireless
OperatingRevenue $ 49,332 $ 43,882 $ 38,043
Domestic Wireless’s total operating revenue in 2008 increased by $5,450
million, or 12.4%, compared to 2007. Service revenue increased by $4,619
million, or 12.2%, in 2008 compared to 2007. The increase in service
revenue was primarily driven by an increase in data revenue in 2008
compared to 2007, and to a lesser extent, an increase in customers as
of December 31, 2008 compared to December 31, 2007. Equipment and
other revenue increased by $831 million, or 14.2%, in 2008 compared
to 2007, primarily as a result of an increase in the number of customers
upgrading their wireless devices. Other revenue also increased due to
increases in cost recovery surcharges and regulatory fees.
Total data revenue in 2008 was $10,651 million and accounted for 25.0%
of service revenue, compared to $7,386 million and 19.4% of service
revenuein2007.TotaldataARPUincreasedby30.2%to$12.89in2008,
compared to $9.90 in 2007, primarily as a result of increased use of our
messaging service, Mobile Broadband and e-mail services, data transport
charges, and newer data services such as VZ Navigator.
ServiceARPUincreasedby1.2%to$51.59in2008,comparedto$50.96in
2007.RetailServiceARPUincreasedby0.6%to$51.88in2008,compared
to $51.57 in 2007.
Domestic Wireless had approximately 70 million retail customers as of
December 31, 2008, an increase of 6.3 million, or 9.9%, compared to
approximately 63.7 million retail customers as of December 31, 2007.
Retail(non-wholesale)customersarecustomerswhoaredirectlyserved
and managed by Verizon Wireless and who buy its branded services.
Domestic Wireless had 72.1 million total customers as of December 31,
2008, of which 97.2% were retail customers, compared to approximately
65.7 million total customers as of December 31, 2007, of which 97.0% were
retail customers. Our Domestic Wireless customer base as of December
31, 2008 was 92.9% retail postpaid, unchanged compared to December
31, 2007. Customer acquisitions and adjustments during 2008 included
approximately 650,000 net total customer additions, after conforming
adjustments,acquiredfromRuralCellularCorporation(RuralCellular).
As a result of the exchange with AT&T consummated on December 22,
2008, Domestic Wireless transferred a net of approximately 122,000 total
customers. The total average monthly customer churn rate was 1.25% in
2008, compared to 1.21% in 2007. The average monthly retail postpaid
customer churn rate was 0.96% in 2008, compared to 0.91% in 2007.
Domestic Wireless’s total operating revenue in 2007 increased by $5,839
million, or 15.3%, compared to 2006. Service revenue in 2007 increased by
$5,220 million, or 15.9%, compared to 2006. The service revenue increase
was primarily due to an 11.3% increase in customers as of December 31,
2007 compared to December 31, 2006, and increased average revenue
per customer. Equipment and other revenue in 2007 increased by $619
million, or 11.8%, compared to 2006, principally as a result of increases
in the number of customers upgrading their wireless devices. Other rev-
enue in 2007 also increased due to increases in cost recovery surcharges
and regulatory fees.
Total data revenue in 2007 was $7,386 million and accounted for 19.4%
of service revenue, compared to $4,475 million and 13.6% of service
revenuein2006.TotaldataARPUincreasedby45.8%to$9.90in2007,
compared to $6.79 in 2006, as a result of increased use of messaging ser-
vice, Broadband Access and e-mail services, and other data services.
ServiceARPUincreasedby2.3%to$50.96in2007comparedto$49.80in
2006.RetailServiceARPUincreasedby2.2%to$51.57in2007compared
to $50.44 in 2006.
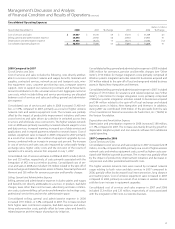
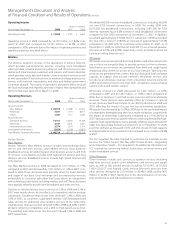
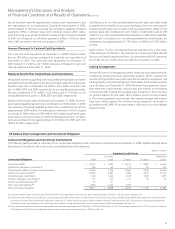
Operating Expenses
(dollars in millions)
Years Ended December 31, 2008 2007 2006
Cost of services and sales $ 15,660 $ 13,456 $ 11,491
Selling, general and administrative expense 14,273 13,477 12,039
Depreciation and amortization expense 5,405 5,154 4,913
Total Operating Expenses $ 35,338 $ 32,087 $ 28,443
Cost of Services and Sales
Cost of services and sales includes costs to operate the wireless network
as well as the cost of roaming and long distance, the cost of data services
and applications and the cost of equipment sales. Cost of services and
sales in 2008 increased by $2,204 million, or 16.4%, compared to 2007.
The increase in cost of services was driven by higher wireless network
costs on increased network usage for voice and data services, increased
roaming, increased use of data services and applications, as well as
increased payments related to network related leases. Cost of equipment
sales increased by 18.9%, in 2008 compared to 2007. This increase was pri-
marily attributable to an increase in the number of equipment upgrades
by customers combined with an increase in average cost per unit.
Cost of services and sales in 2007 increased by $1,965 million, or 17.1%,
compared to 2006, primarily due to higher wireless network costs in
2007 caused by increased network usage, partially offset by lower rates
for long distance, roaming and local interconnection. Cost of equipment
sales grew by 20.2% in 2007 compared to 2006. The increase was pri-
marily attributed to an increase in equipment upgrades, together with
an increase in cost per unit as a result of increased sales of higher cost
advanced wireless devices.
Selling, General and Administrative Expense
Selling, general and administrative expense in 2008 increased by $796
million, or 5.9%, compared to 2007. This increase was primarily due to
an increase in sales commission expense, primarily from an increase in
equipment upgrades in our indirect channel, as well as higher adver-
tising and promotion expense, bad debt expense and regulatory fees.
The increases in selling, general and administrative expense were par-
tially offset by a decrease in salary and benefits related expense.
Selling, general and administrative expense in 2007 increased by $1,438
million, or 11.9%, compared to 2006. This increase was primarily due to
an increase in salary and benefits expense, resulting from an increase in
employees in the sales and customer care areas, and higher per employee
salary and benefit costs.
Depreciation and Amortization Expense
Depreciation and amortization expense in 2008 increased by $251 mil-
lion, or 4.9%, compared to 2007 and increased by $241 million, or 4.9%,
in 2007 compared to 2006. These increases were primarily due to an
increase in depreciable assets. Partially offsetting this increase in 2007
was lower amortization expense resulting from customer lists becoming
fully amortized during 2006.
Management’s Discussion and Analysis
ofFinancialConditionandResultsofOperations continued