Verizon Wireless 2008 Annual Report Download - page 70
Download and view the complete annual report
Please find page 70 of the 2008 Verizon Wireless annual report below. You can navigate through the pages in the report by either clicking on the pages listed below, or by using the keyword search tool below to find specific information within the annual report.-
 1
1 -
2
-
3
-
4
-
5
-
6
-
7
-
8
-
9
-
10
-
11
-
12
-
13
-
14
-
15
-
16
-
17
-
18
-
19
-
20
-
21
-
22
-
23
-
24
-
25
-
26
-
27
-
28
-
29
-
30
-
31
-
32
-
33
-
34
-
35
-
36
-
37
-
38
-
39
-
40
-
41
-
42
-
43
-
44
-
45
-
46
-
47
-
48
-
49
-
50
-
51
-
52
-
53
-
54
-
55
-
56
-
57
-
58
-
59
-
 60
60 -
 61
61 -
 62
62 -
 63
63 -
 64
64 -
 65
65 -
 66
66 -
 67
67 -
 68
68 -
 69
69 -
 70
70 -
 71
71 -
 72
72 -
 73
73 -
 74
74 -
 75
75 -
 76
76
 |
 |

68
Notes to Consolidated Financial Statements continued
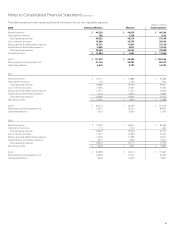
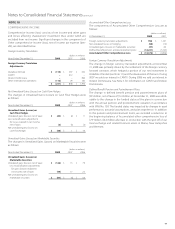
Reconciliation To Consolidated Financial Information
A reconciliation of the segment operating revenues and expenses to the consolidated operating revenues and expenses is as follows:
(dollars in millions)
2008 2007 2006
Operating Revenues
Total reportable segments $ 97,546 $ 93,011 $ 87,547
Reconciling items:
Impact of dispositions and operations sold 258 1,094 1,191
Corporate, eliminations and other (450) (636) (556)
Consolidated operating revenues – reported $ 97,354 $ 93,469 $ 88,182
Operating Expenses
Total reportable segments $ 79,690 $ 76,722 $ 73,556
Reconciling items:
Merger integration costs (see Note 2) 174 178 232
Access line spin-o related charges (see Note 3) 103 84 –
Taxes on foreign distributions (see Note 7) –15 –
Verizon Center relocation (see Note 6) –– 184
Severance, pension and benet charges, net (see Note 15) 950 772 425
Impact of disposition and operations sold (see Note 3) 214 912 1,016
Verizon Foundation contribution (see Note 3) –100 –
Corporate, eliminations and other (661) (892) (604)
Consolidated operating expenses – reported $ 80,470 $ 77,891 $ 74,809
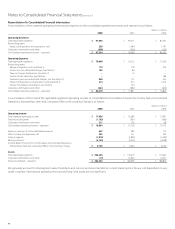
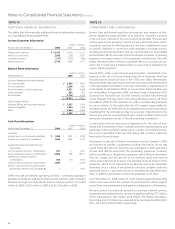
A reconciliation of the total of the reportable segments’ operating income to consolidated Income Before Provision for Income Taxes, Discontinued
Operations, Extraordinary Item and Cumulative Effect of Accounting Change is as follows:
(dollars in millions)
2008 2007 2006
Operating Income
Total segment operating income $ 17,856 $ 16,289 $ 13,991
Total reconciling items (1,183) (967) (666)
Corporate, eliminations and other 211 256 48
Consolidated operating income – reported $ 16,884 $ 15,578 $ 13,373
Equity in earnings of unconsolidated businesses 567 585 773
Other income and (expense), net 282 211 395
Interest expense (1,819) (1,829) (2,349)
Minority interest (6,155) (5,053) (4,038)
Income Before Provision for Income Taxes, Discontinued Operations,
Extraordinary item and Cumulative Eect of Accounting Change $ 9,759 $ 9,492 $ 8,154
Assets
Total reportable segments $ 202,365 $ 176,019 $ 174,263
Corporate, eliminations and other (13) 10,940 14,541
Total consolidated – reported $ 202,352 $ 186,959 $ 188,804
We generally account for intersegment sales of products and services and asset transfers at current market prices. We are not dependent on any
single customer. International operating revenues and long-lived assets are not significant.