Verizon Wireless 2008 Annual Report Download - page 23
Download and view the complete annual report
Please find page 23 of the 2008 Verizon Wireless annual report below. You can navigate through the pages in the report by either clicking on the pages listed below, or by using the keyword search tool below to find specific information within the annual report.-
 1
1 -
2
-
3
-
4
-
5
-
6
-
7
-
8
-
9
-
10
-
11
-
12
-
 13
13 -
 14
14 -
 15
15 -
 16
16 -
 17
17 -
 18
18 -
 19
19 -
 20
20 -
 21
21 -
 22
22 -
 23
23 -
 24
24 -
 25
25 -
 26
26 -
 27
27 -
 28
28 -
 29
29 -
 30
30 -
 31
31 -
 32
32 -
 33
33 -
34
-
35
-
36
-
37
-
38
-
39
-
40
-
41
-
42
-
43
-
44
-
45
-
46
-
47
-
48
-
49
-
50
-
51
-
52
-
53
-
54
-
55
-
56
-
57
-
58
-
59
-
60
-
61
-
62
-
63
-
64
-
65
-
66
-
67
-
68
-
69
-
70
-
71
-
72
-
73
-
74
-
75
-
76
 |
 |

21
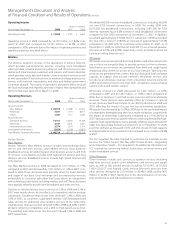
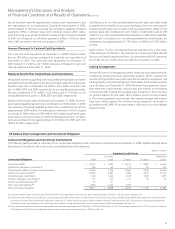
Operating Income
(dollars in millions)
Years Ended December 31, 2008 2007 2006
Operating Income $ 13,994 $ 11,795 $ 9,600
Operating income in 2008 increased by $2,199 million, or 18.6%, com-
pared to 2007 and increased by $2,195 million, or 22.9%, in 2007
compared to 2006, primarily due to the impact of operating revenue and
operating expenses described above.
Wireline
The Wireline segment consists of the operations of Verizon Telecom,
which provides communication services, including voice, broadband
video and data, network access, long distance, and other services to resi-
dential and small business customers and carriers, and Verizon Business,
which provides voice, data and Internet communications services as well
as next-generation IP network services to medium and large business cus-
tomers, multi-national corporations, and state and federal government
customers globally. The results of operations presented below exclude
the local exchange and related businesses in Maine, New Hampshire and
Vermont that were spun-off on March 31, 2008.
Operating Revenues
(dollars in millions)
Years Ended December 31, 2008 2007 2006
Verizon Telecom
Mass Markets $ 20,974 $ 21,289 $ 21,542
Wholesale 7,571 7,774 8,017
Other 1,367 1,717 2,200
Verizon Business
Enterprise Business 14,411 14,550 14,164
Wholesale 3,341 3,345 3,281
International and Other 3,374 3,214 3,101
Intrasegment eliminations (2,824) (2,760) (2,801)
TotalWirelineOperatingRevenues $ 48,214 $ 49,129 $ 49,504
Verizon Telecom
Mass Markets
Verizon Telecom’s Mass Markets revenue includes local exchange (basic
service and end-user access), value-added services, long distance,
broadband services for residential and small business accounts and FiOS
TV services. Long distance includes both regional toll services and long
distance services. Broadband services include high speed Internet and
FiOS Internet.
Our Mass Markets revenue in 2008 decreased by $315 million, or 1.5%,
compared to 2007 and decreased by $253 million, or 1.2% in 2007, com-
pared to 2006. These decreases were primarily driven by lower demand
and usage of our basic local exchange and accompanying services,
attributable to consumer subscriber line losses driven by competition
and technology substitution, including wireless and VoIP. These decreases
were partially offset by growth from broadband and video services.
Declines in switched access lines in service of 9.3% in 2008 and 8.1% in
2007 were mainly driven by the effects of competition and technology
substitution.Residentialretailaccesslinesdeclined11.4%in2008and
9.5% in 2007, as customers substituted wireless, VoIP, broadband and
cable services for traditional voice landline services. At the same time,
small business retail access lines declined 5.0% in 2008 and 4.0% in 2007,
primarily reflecting competition and a shift to high-speed access lines.
The resulting total retail access line loss was 9.1% and 7.6% in 2008 and
2007, respectively.
We added 660,000 net new broadband connections, including 956,000
net new FiOS Internet connections, in 2008. We ended 2008 with
8,673,000 net broadband connections, including 2,481,000 for FiOS
Internet, representing an 8.2% increase in total broadband connections
compared to 8,013,000 connections at December 31, 2007. In addition,
we added approximately 975,000 FiOS TV customers in 2008 and ended
the year with a total of 1,918,000, an increase of approximately 103.4%
compared to 943,000 FiOS TV customers at December 31, 2007. As of
December 31, 2008, for FiOS Internet and FiOS TV, we achieved penetra-
tion rates of 24.9% and 20.8%, respectively, across all markets where we
have been selling these services.
Wholesale
Wholesale revenues are earned from long distance and other carriers who
use our local exchange facilities to provide services to their customers.
Switched access revenues are generated from fixed and usage-based
charges paid by carriers for access to our local network. Special access
revenues are generated from carriers that buy dedicated local exchange
capacity to support their private networks. Wholesale services also
include local wholesale revenues from unbundled network elements
(UNEs) and interconnection revenues from competitive local exchange
carriers (CLECs) and wireless carriers.
Wholesale revenues in 2008 decreased by $203 million, or 2.6%,
compared to 2007 and by $243 million, or 3.0% in 2007 compared to
2006, due to declines in switched access revenues and local wholesale
revenues. These declines were partially offset by increases in special
access revenues. Switched minutes of use (MOUs) declined in 2008 and
2007, reflecting the impact of access line loss and wireless substitution.
Wholesale lines decreased by 16.0% in 2008 due to the continued impact
of competitors deemphasizing their local market initiatives coupled with
the impact of technology substitution compared to a 16.1% decline in
2007. Special access revenue growth reflects continuing demand for high-
capacity, high-speed digital services, partially offset by lower demand for
older, low-speed data products and services. As of December 31, 2008,
customer demand, as measured in DS1 and DS3 circuits, for high-capacity
and digital data services increased 5.1% compared to an increase of 8.2%
in 2007.
The FCC regulates the rates charged to customers for interstate access
services.See“OtherFactorsThatMayAffectFutureResults–Regulatory
andCompetitiveTrends–FCCRegulation”foradditionalinformationon
FCC rulemaking concerning federal access rates, universal service and
certain broadband services.
OtherRevenues
Other revenues include such services as operator services (including
deaf relay services), public (coin) telephone, card services and supply
sales, as well as dial around services including 10-10-987, 10-10-220,
1-800-COLLECT and Prepaid Cards. Verizon Telecom’s revenues from
other services decreased by $350 million, or 20.4% in 2008, and by $483
million, or 22.0% in 2007, mainly due to the discontinuation of non-stra-
tegic product lines and reduced business volumes.
Management’s Discussion and Analysis
ofFinancialConditionandResultsofOperations continued