Facebook 2014 Annual Report Download - page 33
Download and view the complete annual report
Please find page 33 of the 2014 Facebook annual report below. You can navigate through the pages in the report by either clicking on the pages listed below, or by using the keyword search tool below to find specific information within the annual report.-
 1
1 -
2
-
3
-
4
-
5
-
6
-
7
-
8
-
9
-
10
-
11
-
12
-
13
-
14
-
15
-
16
-
17
-
18
-
19
-
20
-
21
-
22
-
 23
23 -
 24
24 -
 25
25 -
 26
26 -
 27
27 -
 28
28 -
 29
29 -
 30
30 -
 31
31 -
 32
32 -
 33
33 -
 34
34 -
 35
35 -
 36
36 -
 37
37 -
 38
38 -
 39
39 -
 40
40 -
 41
41 -
 42
42 -
 43
43 -
44
-
45
-
46
-
47
-
48
-
49
-
50
-
51
-
52
-
53
-
54
-
55
-
56
-
57
-
58
-
59
-
60
-
61
-
62
-
63
-
64
-
65
-
66
-
67
-
68
-
69
-
70
-
71
-
72
-
73
-
74
-
75
-
76
-
77
-
78
-
79
-
80
-
81
-
82
-
83
-
84
-
85
-
86
-
87
-
88
-
89
-
90
-
91
-
92
-
93
-
94
-
95
-
96
-
97
-
98
-
99
-
100
-
101
-
102
-
103
-
104
-
105
-
106
-
107
-
108
-
109
-
110
-
111
-
112
-
113
-
114
-
115
-
116
-
117
-
118
-
119
-
120
-
121
-
122
-
123
-
124
-
125
-
126
-
127
-
128
 |
 |
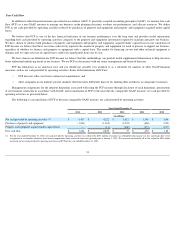
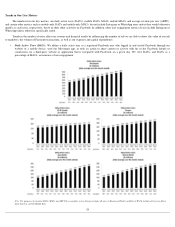
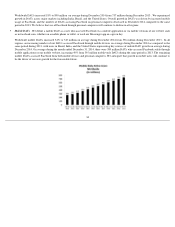
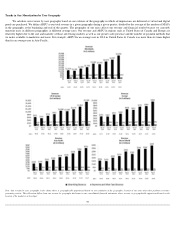
You should read the following selected consolidated financial data in conjunction with Part II, Item 7, "Management's Discussion and Analysis of
Financial Condition and Results of Operations," and our consolidated financial statements and the related notes included in Part II, Item 8, "Financial
Statements and Supplementary Data" of this Annual Report on Form 10-K.
The consolidated statements of income data for each of the years ended December 31, 2014 , 2013 , and 2012
and the consolidated balance sheets
data as of December 31, 2014 and 2013
are derived from our audited consolidated financial statements included in Part II, Item 8, "Financial Statements
and Supplementary Data" of this Annual Report on Form 10-K. The consolidated statements of income data for the years ended December 31, 2011
and
2010 and the consolidated balance sheets data as of December 31, 2012 , 2011 , and 2010
are derived from our audited consolidated financial statements
that are not included in this Annual Report on Form 10-K. Our historical results are not necessarily indicative of our results in any future period.
30
Item 6.
Selected Financial Data.
Year Ended December 31,
2014
2013
2012
2011
2010
(in millions, except per share data)
Consolidated Statements of Income Data:
Revenue
$
12,466
$
7,872
$
5,089
$
3,711
$
1,974
Total costs and expenses
(1)
7,472
5,068
4,551
1,955
942
Income from operations
4,994
2,804
538
1,756
1,032
Income before provision for income taxes
4,910
2,754
494
1,695
1,008
Net income
2,940
1,500
53
1,000
606
Net income attributable to Class A and Class B
common stockholders
2,925
1,491
32
668
372
Earnings per share attributable to Class A and Class B
common stockholders
(2)
:
Basic
$
1.12
$
0.62
$
0.02
$
0.52
$
0.34
Diluted
$
1.10
$
0.60
$
0.01
$
0.46
$
0.28
(1) Total costs and expenses include $1.84 billion , $906 million , $1.57 billion , $217 million, and $20 million of share-based compensation for the years ended December 31, 2014 , 2013
,
2012 , 2011 , and 2010 , respectively.
(2)
See Note 3 of the notes to our consolidated financial statements for a description of our computation of basic and diluted earnings per share attributable to Class A and Class B common
stockholders.
As of December 31,
2014
2013
2012
2011
2010
(in millions)
Consolidated Balance Sheets Data:
Cash, cash equivalents, and marketable securities
$
11,199
$
11,449
$
9,626
$
3,908
$
1,785
Working capital
12,246
11,970
10,215
3,705
1,857
Property and equipment, net
3,967
2,882
2,391
1,475
574
Total assets
40,184
17,895
15,103
6,331
2,990
Capital lease obligations
233
476
856
677
223
Long-term debt —
—
1,500
—
250
Total liabilities
4,088
2,425
3,348
1,432
828
Additional paid-in capital
30,225
12,297
10,094
2,684
947
Total stockholders' equity
36,096
15,470
11,755
4,899
2,162