Facebook 2014 Annual Report Download - page 40
Download and view the complete annual report
Please find page 40 of the 2014 Facebook annual report below. You can navigate through the pages in the report by either clicking on the pages listed below, or by using the keyword search tool below to find specific information within the annual report.-
 1
1 -
2
-
3
-
4
-
5
-
6
-
7
-
8
-
9
-
10
-
11
-
12
-
13
-
14
-
15
-
16
-
17
-
18
-
19
-
20
-
21
-
22
-
23
-
24
-
25
-
26
-
27
-
28
-
29
-
 30
30 -
 31
31 -
 32
32 -
 33
33 -
 34
34 -
 35
35 -
 36
36 -
 37
37 -
 38
38 -
 39
39 -
 40
40 -
 41
41 -
 42
42 -
 43
43 -
 44
44 -
 45
45 -
 46
46 -
 47
47 -
 48
48 -
 49
49 -
 50
50 -
51
-
52
-
53
-
54
-
55
-
56
-
57
-
58
-
59
-
60
-
61
-
62
-
63
-
64
-
65
-
66
-
67
-
68
-
69
-
70
-
71
-
72
-
73
-
74
-
75
-
76
-
77
-
78
-
79
-
80
-
81
-
82
-
83
-
84
-
85
-
86
-
87
-
88
-
89
-
90
-
91
-
92
-
93
-
94
-
95
-
96
-
97
-
98
-
99
-
100
-
101
-
102
-
103
-
104
-
105
-
106
-
107
-
108
-
109
-
110
-
111
-
112
-
113
-
114
-
115
-
116
-
117
-
118
-
119
-
120
-
121
-
122
-
123
-
124
-
125
-
126
-
127
-
128
 |
 |

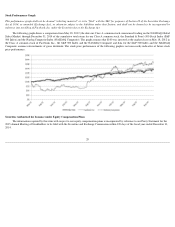
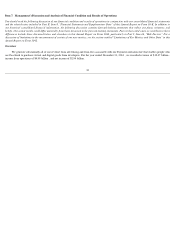
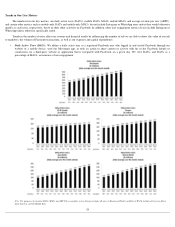
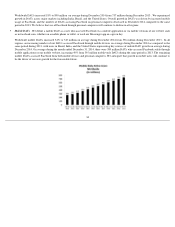
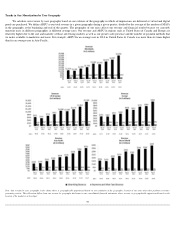
Trends in Our Monetization by User Geography
We calculate our revenue by user geography based on our estimate of the geography in which ad impressions are delivered or virtual and digital
goods are purchased. We define ARPU as our total revenue in a given geography during a given quarter, divided by the average of the number of MAUs
in the geography at the beginning and end of the quarter. The geography of our users affects our revenue and financial results because we currently
monetize users in different geographies at different average rates. Our revenue and ARPU in regions such as United States & Canada and Europe are
relatively higher due to the size and maturity of those advertising markets as well as our greater sales presence and the number of payment methods that
we make available to marketers and users. For example, ARPU for an average user in 2014 in United States & Canada was more than six times higher
than for an average user in Asia-Pacific.
Note: Our revenue by user geography in the charts above is geographically apportioned based on our estimation of the geographic location of our users when they perform a revenue
-
generating activity. This allocation differs from our revenue by geography disclosure in our consolidated financial statements where revenue is geographically apportioned based on the
location of the marketer or developer.
37