Facebook 2014 Annual Report Download - page 45
Download and view the complete annual report
Please find page 45 of the 2014 Facebook annual report below. You can navigate through the pages in the report by either clicking on the pages listed below, or by using the keyword search tool below to find specific information within the annual report.-
 1
1 -
2
-
3
-
4
-
5
-
6
-
7
-
8
-
9
-
10
-
11
-
12
-
13
-
14
-
15
-
16
-
17
-
18
-
19
-
20
-
21
-
22
-
23
-
24
-
25
-
26
-
27
-
28
-
29
-
30
-
31
-
32
-
33
-
34
-
 35
35 -
 36
36 -
 37
37 -
 38
38 -
 39
39 -
 40
40 -
 41
41 -
 42
42 -
 43
43 -
 44
44 -
 45
45 -
 46
46 -
 47
47 -
 48
48 -
 49
49 -
 50
50 -
 51
51 -
 52
52 -
 53
53 -
 54
54 -
 55
55 -
56
-
57
-
58
-
59
-
60
-
61
-
62
-
63
-
64
-
65
-
66
-
67
-
68
-
69
-
70
-
71
-
72
-
73
-
74
-
75
-
76
-
77
-
78
-
79
-
80
-
81
-
82
-
83
-
84
-
85
-
86
-
87
-
88
-
89
-
90
-
91
-
92
-
93
-
94
-
95
-
96
-
97
-
98
-
99
-
100
-
101
-
102
-
103
-
104
-
105
-
106
-
107
-
108
-
109
-
110
-
111
-
112
-
113
-
114
-
115
-
116
-
117
-
118
-
119
-
120
-
121
-
122
-
123
-
124
-
125
-
126
-
127
-
128
 |
 |
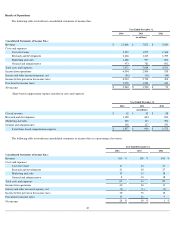
Results of Operations
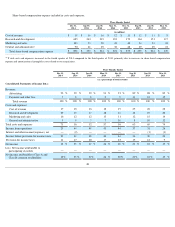
The following table sets forth our consolidated statements of income data:
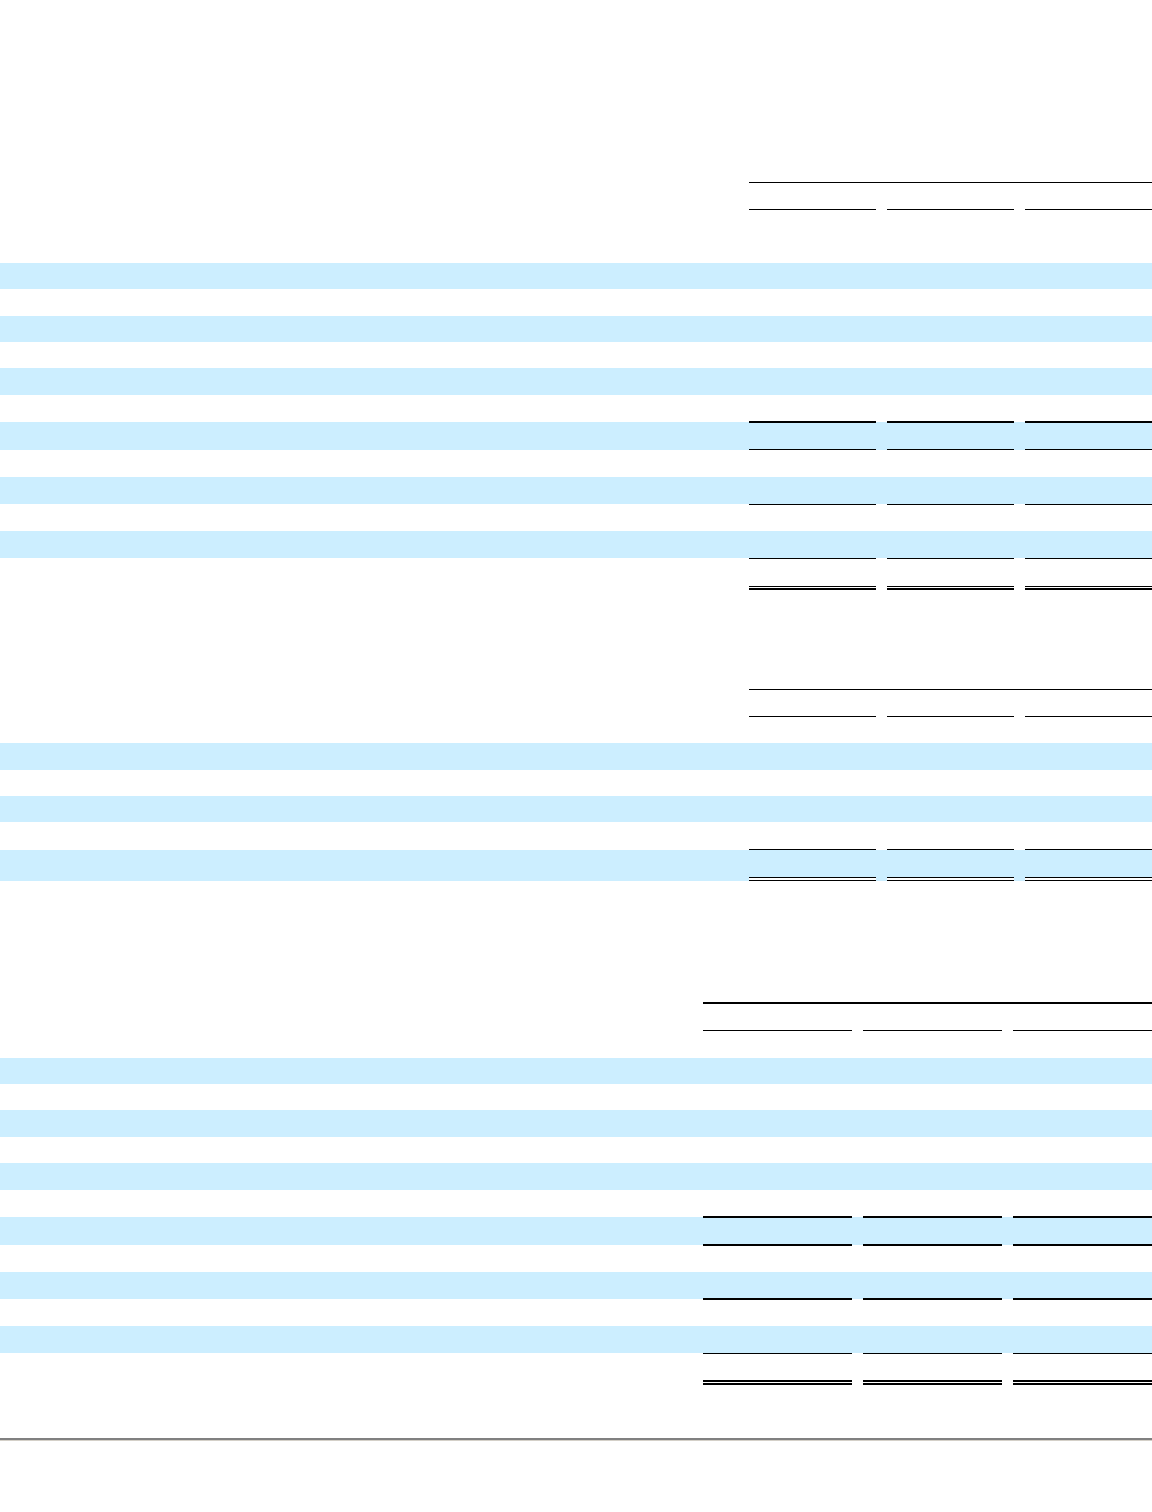
Share-based compensation expense included in costs and expenses:
The following table sets forth our consolidated statements of income data (as a percentage of revenue):
42
Year Ended December 31,
2014
2013
2012
(in millions)
Consolidated Statements of Income Data:
Revenue
$
12,466
$
7,872
$
5,089
Costs and expenses:
Cost of revenue
2,153
1,875
1,364
Research and development
2,666
1,415
1,399
Marketing and sales
1,680
997
896
General and administrative
973
781
892
Total costs and expenses
7,472
5,068
4,551
Income from operations
4,994
2,804
538
Interest and other income/(expense), net
(84
)
(50
)
(44
)
Income before provision for income taxes
4,910
2,754
494
Provision for income taxes
1,970
1,254
441
Net income
$
2,940
$
1,500
$
53
Year Ended December 31,
2014
2013
2012
(in millions)
Cost of revenue
$
62
$
42
$
88
Research and development
1,328
604
843
Marketing and sales
249
133
306
General and administrative
198
127
335
Total share-based compensation expense
$
1,837
$
906
$
1,572
Year Ended December 31,
2014
2013
2012
Consolidated Statements of Income Data:
Revenue
100
%
100
%
100
%
Costs and expenses:
Cost of revenue
17
24
27
Research and development
21
18
27
Marketing and sales
13
13
18
General and administrative
8
10
18
Total costs and expenses
60
64
89
Income from operations
40
36
11
Interest and other income/(expense), net
(1
)
(1
)
(1
)
Income before provision for income taxes
39
35
10
Provision for income taxes
16
16
9
Net income
24
%
19
%
1
%