Facebook 2014 Annual Report Download - page 46
Download and view the complete annual report
Please find page 46 of the 2014 Facebook annual report below. You can navigate through the pages in the report by either clicking on the pages listed below, or by using the keyword search tool below to find specific information within the annual report.-
 1
1 -
2
-
3
-
4
-
5
-
6
-
7
-
8
-
9
-
10
-
11
-
12
-
13
-
14
-
15
-
16
-
17
-
18
-
19
-
20
-
21
-
22
-
23
-
24
-
25
-
26
-
27
-
28
-
29
-
30
-
31
-
32
-
33
-
34
-
35
-
 36
36 -
 37
37 -
 38
38 -
 39
39 -
 40
40 -
 41
41 -
 42
42 -
 43
43 -
 44
44 -
 45
45 -
 46
46 -
 47
47 -
 48
48 -
 49
49 -
 50
50 -
 51
51 -
 52
52 -
 53
53 -
 54
54 -
 55
55 -
 56
56 -
57
-
58
-
59
-
60
-
61
-
62
-
63
-
64
-
65
-
66
-
67
-
68
-
69
-
70
-
71
-
72
-
73
-
74
-
75
-
76
-
77
-
78
-
79
-
80
-
81
-
82
-
83
-
84
-
85
-
86
-
87
-
88
-
89
-
90
-
91
-
92
-
93
-
94
-
95
-
96
-
97
-
98
-
99
-
100
-
101
-
102
-
103
-
104
-
105
-
106
-
107
-
108
-
109
-
110
-
111
-
112
-
113
-
114
-
115
-
116
-
117
-
118
-
119
-
120
-
121
-
122
-
123
-
124
-
125
-
126
-
127
-
128
 |
 |
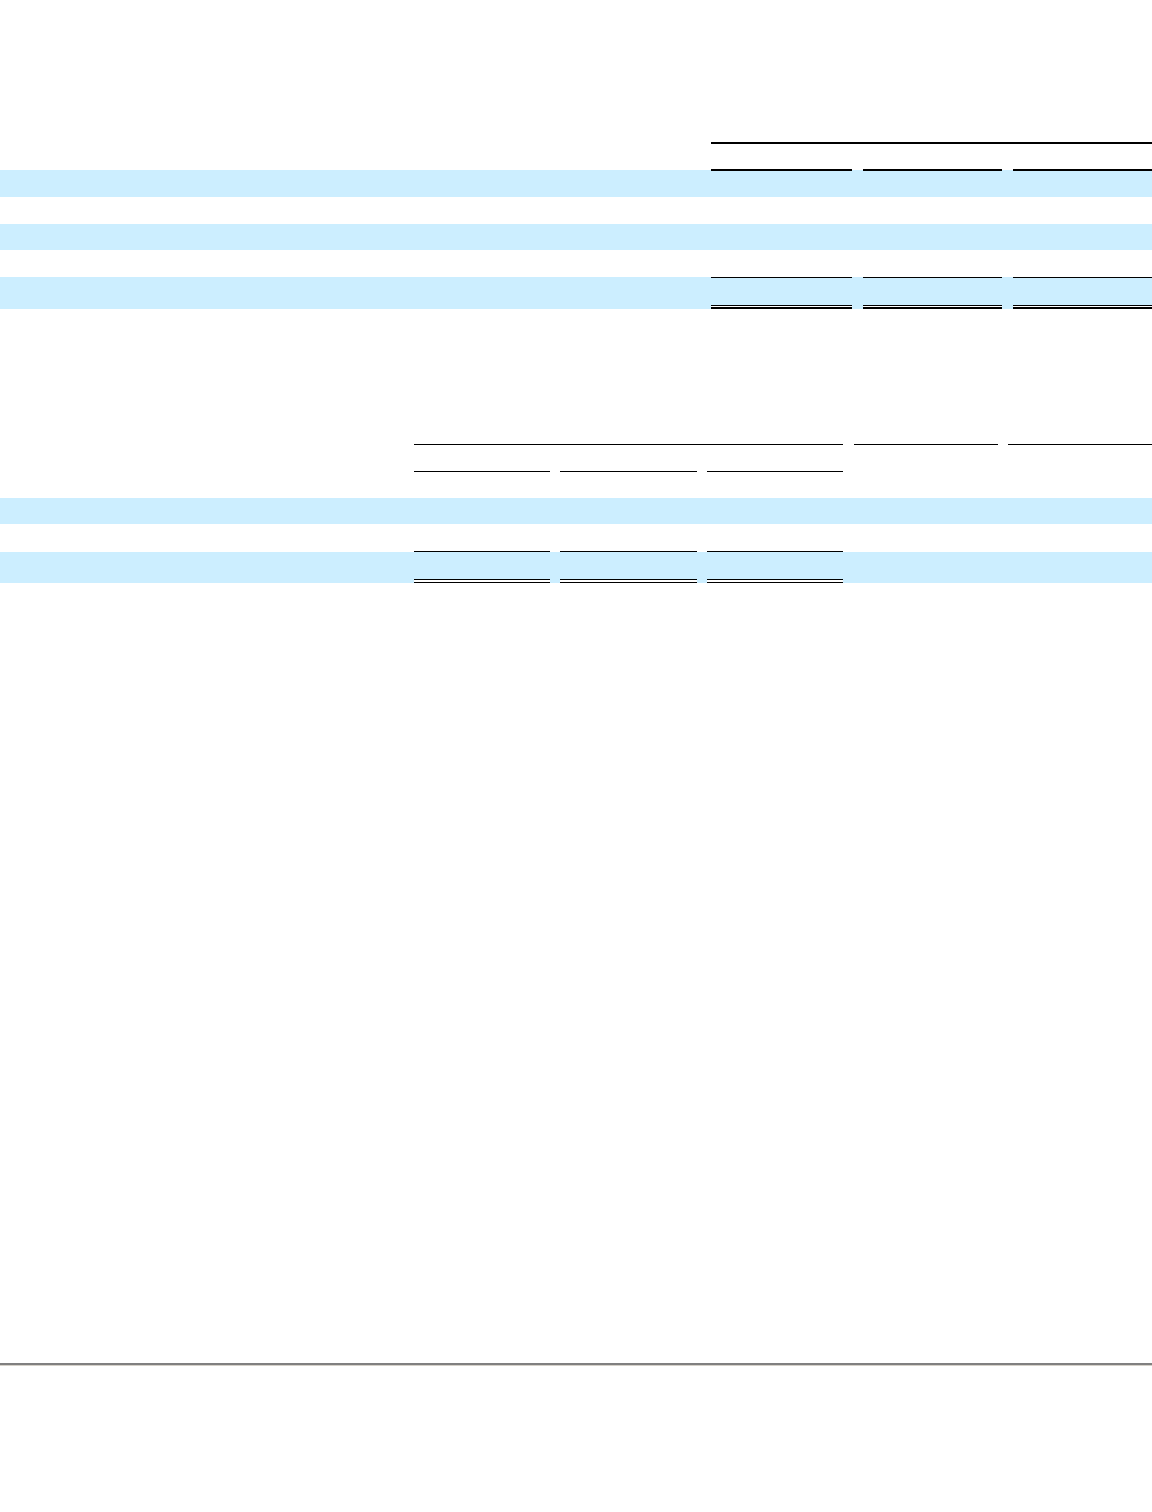
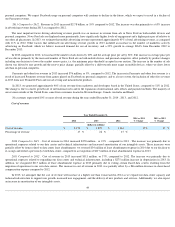
Share-based compensation expense included in costs and expenses (as a percentage of revenue):
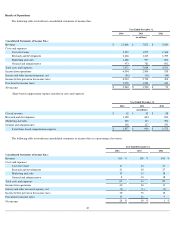
Revenue
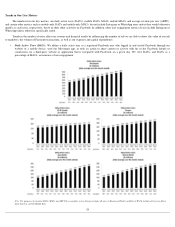
2014 Compared to 2013 . Revenue in 2014 increased $4.59 billion , or 58% compared to 2013 . The increase was due primarily to a 65%
increase
in advertising revenue during 2014 as compared to 2013 .
The most important factor driving advertising revenue growth was an increase in revenue from ads in News Feed on both mobile devices and
personal computers. News Feed ads are displayed more prominently, have significantly higher levels of engagement and a higher price per ad relative to
our other ad placements. In 2014 , we estimate that mobile advertising revenue represented approximately 65%
of total advertising revenue, as compared
with 45% in 2013 . Other factors that influenced our advertising revenue growth in 2014
included (i) an increase in the number of marketers actively
advertising on Facebook, which we believe increased demand for our ad inventory, (ii) other product changes to increase the value and performance of
our ads, and (iii) an increase in user growth and engagement.
In 2014 compared to 2013
, the average price per ad increased by 173% and the number of ads delivered decreased by 40%. The increase in
average price per ad was driven by a product change related to certain non-
News Feed ads during the third quarter of 2014, which decreased the number
of ads displayed but increased the prominence of each ad. Average price per ad was also driven by a mix shift towards a greater percentage of our ads
being shown in News Feed. The reduction in ads delivered was driven by factors including the product change described above as well as the shift in
usage towards mobile devices where people are shown fewer ads as compared to personal computers.
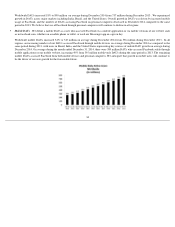
Advertising revenue in the fourth quarter of 2014 increased 53% compared to the same period in 2013
. The increase in advertising revenue in the
fourth quarter of 2014 was driven by the same factors that drove 2014
annual advertising revenue growth, primarily an increase in revenue from ads in
News Feed on both mobile devices and personal computers. For the fourth quarter of
2014
, we estimate that mobile advertising revenue represented
approximately 69% of total advertising revenue, as compared with 53% in the same period in 2013.
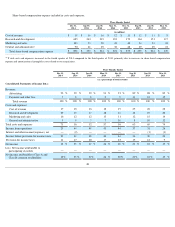
Advertising spending is traditionally seasonally strong in the fourth quarter of each year. We believe that this seasonality in advertising spending
affects our quarterly results, which generally reflect significant growth in advertising revenue between the third and fourth quarters and a decline in
advertising spending between the fourth and subsequent first quarters. For instance, our advertising revenue increased 22%, 30%, and 22% between the
third and fourth quarters of 2014, 2013, and 2012, respectively, while advertising revenue for the first quarter of 2014 and 2013 declined 3% and 6%
compared to the fourth quarters of 2013 and 2012, respectively.
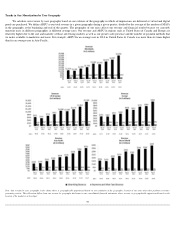
Payments and other fees revenue in 2014 increased $88 million , or 10% , compared to 2013
. The increase in Payments and other fees revenue is
a result of increased revenue from our ad serving and measurement products and the delivery of virtual reality platform devices.
Payments and other fees revenue in the fourth quarter of 2014 was $ 257 million , as compared to $241 million in the same period of 2013
.
Payments and other fees revenue is currently based predominantly on Payments revenue from games played on
43
Year Ended December 31,
2014
2013
2012
Cost of revenue —
%
1
%
2
%
Research and development
11
8
17
Marketing and sales
2
2
6
General and administrative
2
2
7
Total share-based compensation expense
15
%
12
%
31
%
Year Ended December 31,
2014 vs 2013
% Change
2013 vs 2012
% Change
2014
2013
2012
(in millions)
Advertising
$
11,492
$
6,986
$
4,279
65
%
63
%
Payments and other fees
974
886
810
10
%
9
%
Total revenue
$
12,466
$
7,872
$
5,089
58
%
55
%