Facebook 2014 Annual Report Download - page 70
Download and view the complete annual report
Please find page 70 of the 2014 Facebook annual report below. You can navigate through the pages in the report by either clicking on the pages listed below, or by using the keyword search tool below to find specific information within the annual report.-
 1
1 -
2
-
3
-
4
-
5
-
6
-
7
-
8
-
9
-
10
-
11
-
12
-
13
-
14
-
15
-
16
-
17
-
18
-
19
-
20
-
21
-
22
-
23
-
24
-
25
-
26
-
27
-
28
-
29
-
30
-
31
-
32
-
33
-
34
-
35
-
36
-
37
-
38
-
39
-
40
-
41
-
42
-
43
-
44
-
45
-
46
-
47
-
48
-
49
-
50
-
51
-
52
-
53
-
54
-
55
-
56
-
57
-
58
-
59
-
 60
60 -
 61
61 -
 62
62 -
 63
63 -
 64
64 -
 65
65 -
 66
66 -
 67
67 -
 68
68 -
 69
69 -
 70
70 -
 71
71 -
 72
72 -
 73
73 -
 74
74 -
 75
75 -
 76
76 -
 77
77 -
 78
78 -
 79
79 -
 80
80 -
81
-
82
-
83
-
84
-
85
-
86
-
87
-
88
-
89
-
90
-
91
-
92
-
93
-
94
-
95
-
96
-
97
-
98
-
99
-
100
-
101
-
102
-
103
-
104
-
105
-
106
-
107
-
108
-
109
-
110
-
111
-
112
-
113
-
114
-
115
-
116
-
117
-
118
-
119
-
120
-
121
-
122
-
123
-
124
-
125
-
126
-
127
-
128
 |
 |

that the carrying amount of property and equipment and intangible assets is not recoverable, the carrying amount of such assets is reduced to fair value.
We have not recorded any significant impairment charge during the years presented.
We review goodwill for impairment at least annually or more frequently if events or changes in circumstances indicate that the carrying value of
goodwill may not be recoverable. We have elected to first assess the qualitative factors to determine whether it is more likely than not that the fair value
of our single reporting unit is less than its carrying amount as a basis for determining whether it is necessary to perform the two-
step goodwill
impairment under Accounting Standards Update (ASU) No. 2011-08, Goodwill and Other (Topic 350): Testing Goodwill for Impairment,
issued by the
Financial Accounting Standards Board (FASB). If we determine that it is more likely than not that its fair value is less than its carrying amount, then the
two-
step goodwill impairment test is performed. The first step, identifying a potential impairment, compares the fair value of the reporting unit with its
carrying amount. If the carrying amount exceeds its fair value, the second step would need to be performed; otherwise, no further step is required. The
second step, measuring the impairment loss, compares the implied fair value of the goodwill with the carrying amount of the goodwill. Any excess of
the goodwill carrying amount over the applied fair value is recognized as an impairment loss, and the carrying value of goodwill is written down to fair
value. As of December 31, 2014 , no impairment of goodwill has been identified.
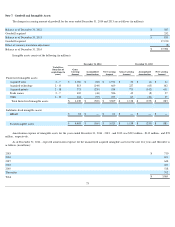
Acquired finite-lived intangible assets are amortized on a straight-
line basis over the estimated useful lives of the assets. The estimated remaining
useful lives for intangible assets range from less than one year to 15 years . Acquired indefinite-lived intangible assets related to our in-
process research
and development (IPR&D) are capitalized and subject to impairment testing until completion or abandonment of the projects. Upon successful
completion of each project, we will make a separate determination of useful life of the acquired indefinite-
lived intangible assets and the related
amortization will be recorded as an expense over the estimated useful life of the specific projects.
In addition to the recoverability assessment, we routinely review the remaining estimated useful lives of property and equipment and finite-
lived
intangible assets. If we reduce the estimated useful life assumption for any asset, the remaining unamortized balance would be amortized or depreciated
over the revised estimated useful life.
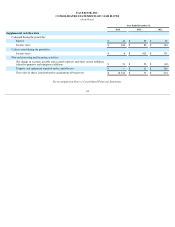
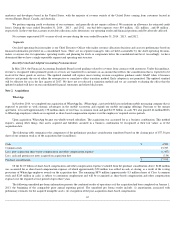
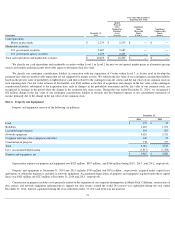
Deferred Revenue and Deposits
Deferred revenue consists of billings in advance of revenue recognition. Deposits relate to unused balances held on behalf of our users. Once this
balance is utilized by a user, approximately 70%
of this amount would then be payable to the developer and the balance would be recognized as revenue.
Deferred revenue and deposits consists of the following (in millions):
Foreign Currency
Generally the functional currency of our international subsidiaries is the local currency. We translate the financial statements of these subsidiaries
to U.S. dollars using month-
end rates of exchange for assets and liabilities, and average rates of exchange for revenue, costs, and expenses. Translation
gains and losses are recorded in accumulated other comprehensive (loss) income as a component of stockholders' equity. As of December 31, 2014
and
2013 , we had a cumulative translation loss of $227 million and a cumulative translation gain of $12 million
, respectively. Net losses resulting from
foreign exchange transactions were $87 million , $14 million , and $9 million for the years ended December 31, 2014 , 2013 , and 2012
, respectively.
These losses were recorded as interest and other income/(expense), net on our consolidated statements of income.
Credit Risk and Concentration
Financial instruments owned by the company that are potentially subject to concentrations of credit risk consist primarily of cash, cash
equivalents, restricted cash, marketable securities, and accounts receivable. Cash equivalents consist of short-
term money market funds, which are
managed by reputable financial institutions. Marketable securities consist of investments in
U.S. government securities, U.S. government agency
securities, and corporate debt securities . Our investment policy limits investment instruments to
U.S. government securities, U.S. government agency
securities, and corporate debt securities with the main objective of preserving capital and maintaining liquidity.
Accounts receivable are typically unsecured and are derived from revenue earned from customers across different industries and countries. We
generated 45% , 46% , and 51% of our revenue for the years ended December 31, 2014 , 2013 , and 2012 , respectively, from
66
December 31,
2014
2013
Deferred revenue
$
38
$
13
Deposits
28
25
Total deferred revenue and deposits
$
66
$
38