Facebook 2014 Annual Report Download - page 48
Download and view the complete annual report
Please find page 48 of the 2014 Facebook annual report below. You can navigate through the pages in the report by either clicking on the pages listed below, or by using the keyword search tool below to find specific information within the annual report.-
 1
1 -
2
-
3
-
4
-
5
-
6
-
7
-
8
-
9
-
10
-
11
-
12
-
13
-
14
-
15
-
16
-
17
-
18
-
19
-
20
-
21
-
22
-
23
-
24
-
25
-
26
-
27
-
28
-
29
-
30
-
31
-
32
-
33
-
34
-
35
-
36
-
37
-
 38
38 -
 39
39 -
 40
40 -
 41
41 -
 42
42 -
 43
43 -
 44
44 -
 45
45 -
 46
46 -
 47
47 -
 48
48 -
 49
49 -
 50
50 -
 51
51 -
 52
52 -
 53
53 -
 54
54 -
 55
55 -
 56
56 -
 57
57 -
 58
58 -
59
-
60
-
61
-
62
-
63
-
64
-
65
-
66
-
67
-
68
-
69
-
70
-
71
-
72
-
73
-
74
-
75
-
76
-
77
-
78
-
79
-
80
-
81
-
82
-
83
-
84
-
85
-
86
-
87
-
88
-
89
-
90
-
91
-
92
-
93
-
94
-
95
-
96
-
97
-
98
-
99
-
100
-
101
-
102
-
103
-
104
-
105
-
106
-
107
-
108
-
109
-
110
-
111
-
112
-
113
-
114
-
115
-
116
-
117
-
118
-
119
-
120
-
121
-
122
-
123
-
124
-
125
-
126
-
127
-
128
 |
 |
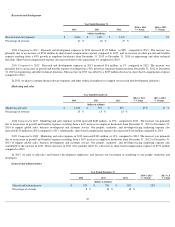
Research and development
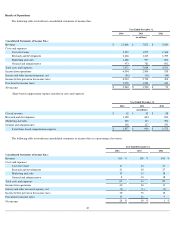
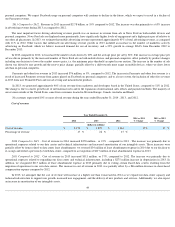
2014 Compared to 2013 . Research and development expenses in 2014 increased $1.25 billion , or 88% , compared to 2013
. The increase was
primarily due to an increase of $724 million in share-
based compensation expense compared to 2013, and an increase in other payroll and benefits
expense resulting from a 48%
growth in employee headcount from December 31, 2013 to December 31, 2014 in engineering and other technical
functions. Share-based compensation expense also increased due to the acquisitions we completed in 2014.
2013 Compared to 2012 .
Research and development expenses in 2013 increased $16 million, or 1%, compared to 2012. The increase was
primarily due to an increase in payroll and benefits expense resulting from a 50% growth in employee headcount from December 31, 2012 to December
31, 2013 in engineering and other technical functions. This increase in 2013 was offset by a $239 million decrease in share-
based compensation expense
compared to 2012.
In 2015, we plan to continue hiring software engineers and other technical employees to support our research and development initiatives.
Marketing and sales
2014 Compared to 2013 . Marketing and sales expenses in 2014 increased $683 million , or 69% , compared to 2013
. The increase was primarily
due to an increase in payroll and benefits expenses resulting from a 44%
increase in employee headcount from December 31, 2013 to December 31,
2014 to support global sales, business development and customer service. Our people-, marketer-, and developer-
facing marketing expense also
increased $150 million in 2014 compared to 2013. Additionally, share-based compensation expense also increased $116 million compared to 2013.
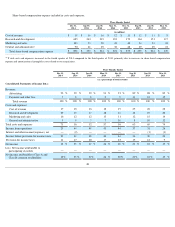
2013 Compared to 2012 .
Marketing and sales expenses in 2013 increased $101 million, or 11%, compared to 2012. The increase was primarily
due to an increase in payroll and benefits expenses resulting from a 36% increase in employee headcount from December 31, 2012 to December 31,
2013 to support global sales, business development and customer service. Our people-, marketer-, and developer-
facing marketing expense also
contributed to the increase in 2013. These increases in 2013 were partially offset by a decrease in share-
based compensation expense of $173 million
compared to 2012.
In 2015, we plan to add sales and business development employees, and increase our investment in marketing to our people, marketers and
developers.
General and administrative
45
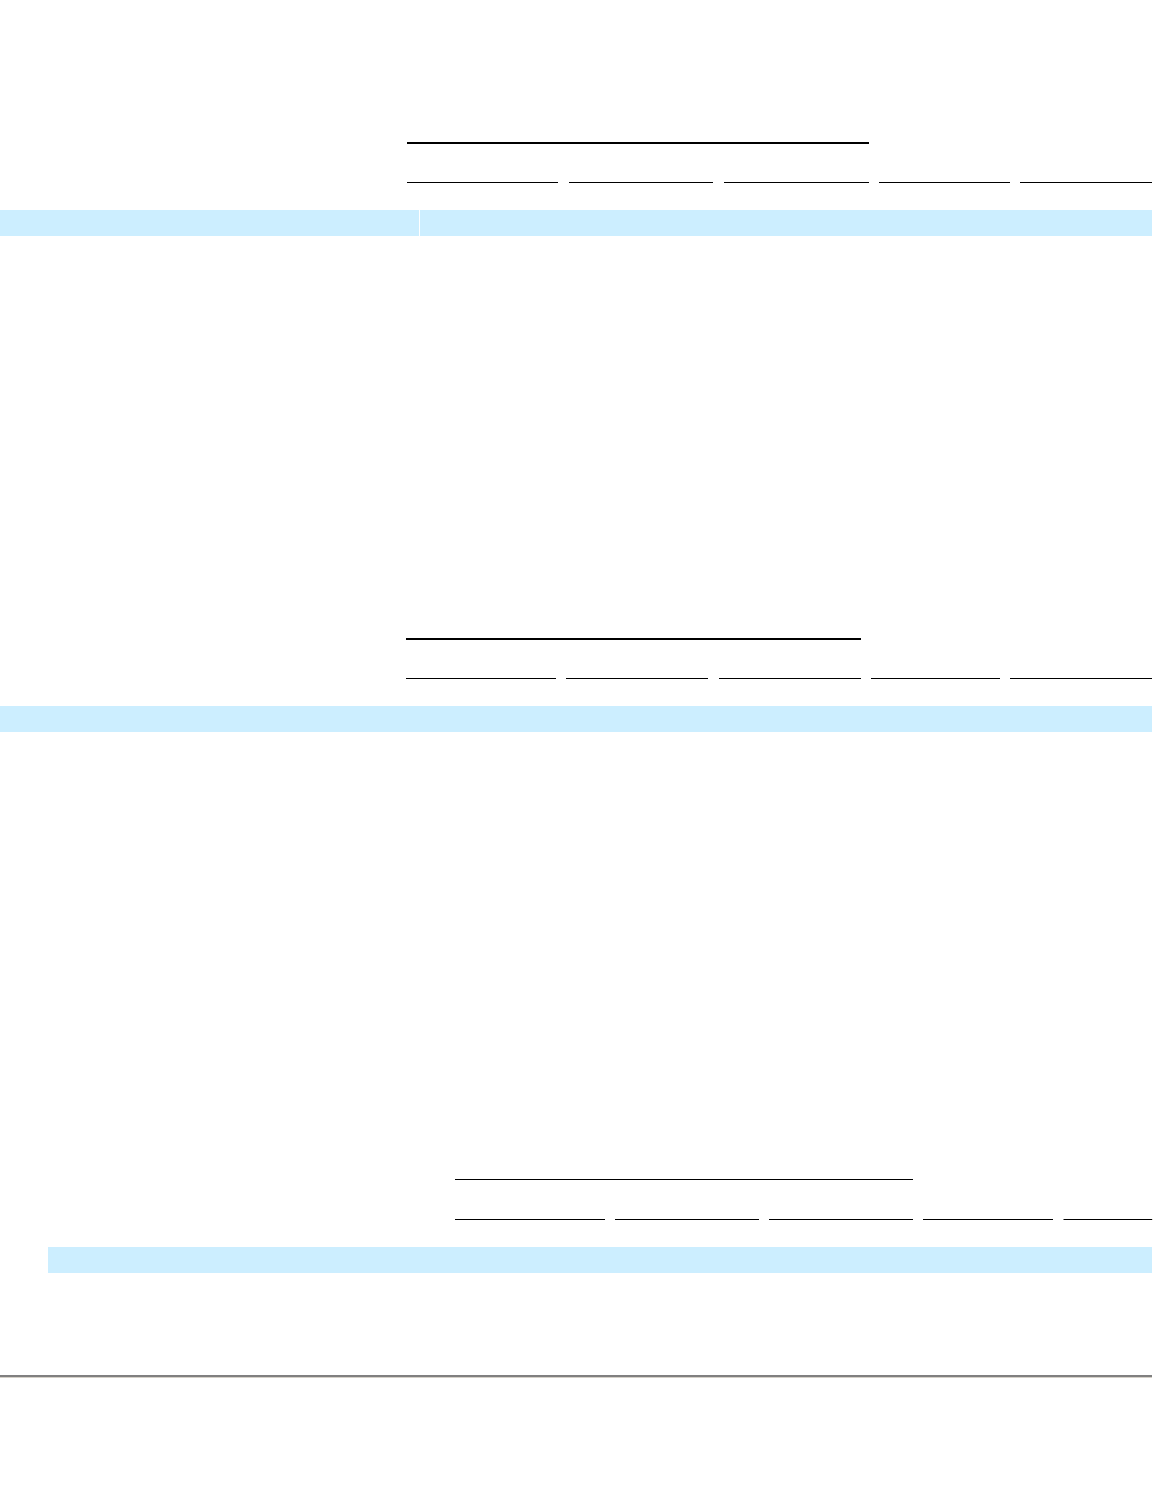
Year Ended December 31,
2014
2013
2012
2014 vs 2013
% Change
2013 vs 2012
% Change
(dollars in millions)
Research and development
$
2,666
$
1,415
$
1,399
88
%
1
%
Percentage of revenue
21
%
18
%
27
%
Year Ended December 31,
2014
2013
2012
2014 vs 2013
% Change
2013 vs 2012
% Change
(dollars in millions)
Marketing and sales
$
1,680
$
997
$
896
69
%
11
%
Percentage of revenue
13
%
13
%
18
%
Year Ended December 31,
2014
2013
2012
2014 vs 2013
% Change
2013 vs 20
% Chang
(dollars in millions)
General and administrative
$
973
$
781
$
892
25
%
(
Percentage of revenue
8
%
10
%
18
%