Facebook 2014 Annual Report Download - page 74
Download and view the complete annual report
Please find page 74 of the 2014 Facebook annual report below. You can navigate through the pages in the report by either clicking on the pages listed below, or by using the keyword search tool below to find specific information within the annual report.-
 1
1 -
2
-
3
-
4
-
5
-
6
-
7
-
8
-
9
-
10
-
11
-
12
-
13
-
14
-
15
-
16
-
17
-
18
-
19
-
20
-
21
-
22
-
23
-
24
-
25
-
26
-
27
-
28
-
29
-
30
-
31
-
32
-
33
-
34
-
35
-
36
-
37
-
38
-
39
-
40
-
41
-
42
-
43
-
44
-
45
-
46
-
47
-
48
-
49
-
50
-
51
-
52
-
53
-
54
-
55
-
56
-
57
-
58
-
59
-
60
-
61
-
62
-
63
-
 64
64 -
 65
65 -
 66
66 -
 67
67 -
 68
68 -
 69
69 -
 70
70 -
 71
71 -
 72
72 -
 73
73 -
 74
74 -
 75
75 -
 76
76 -
 77
77 -
 78
78 -
 79
79 -
 80
80 -
 81
81 -
 82
82 -
 83
83 -
 84
84 -
85
-
86
-
87
-
88
-
89
-
90
-
91
-
92
-
93
-
94
-
95
-
96
-
97
-
98
-
99
-
100
-
101
-
102
-
103
-
104
-
105
-
106
-
107
-
108
-
109
-
110
-
111
-
112
-
113
-
114
-
115
-
116
-
117
-
118
-
119
-
120
-
121
-
122
-
123
-
124
-
125
-
126
-
127
-
128
 |
 |

computed by dividing the resulting net income attributable to common stockholders by the weighted-
average number of fully diluted common shares
outstanding.
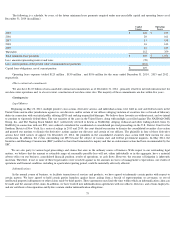
Basic and dilutive securities in our basic and diluted EPS calculation for the year ended December 31, 2014 do not include contingent earn-
out
shares resulting from our acquisition of Oculus. Issuance of these earn-
out shares is dependent upon the completion of certain milestones. These
milestones were not met as of December 31, 2014 and accordingly, these shares are excluded from the effect of basic and dilutive securities.
We have also excluded 14 million , 1 million , and 15 million RSUs for the years ended December 31, 2014 , 2013 , and 2012
, respectively,
because the impact would be anti-dilutive.
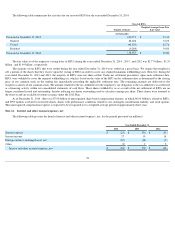
Basic and diluted EPS are the same for each class of common stock because they are entitled to the same liquidation and dividend rights.
The numerators and denominators of the basic and diluted EPS computations for our common stock are calculated as follows (in millions, except
per share amounts):
70
Year Ended December 31,
2014
2013
2012
Class
A
Class
B
Class
A
Class
B
Class
A
Class
B
Basic EPS:
Numerator
Net income
$
2,308
$
632
$
1,114
$
386
$
18
$
35
Less: Net income attributable to participating securities
12
3
7
2
7
14
Net income attributable to common stockholders
$
2,296
$
629
$
1,107
$
384
$
11
$
21
Denominator
Weighted average shares outstanding
2,059
568
1,803
631
668
1,344
Less: Shares subject to repurchase
6
7
5
9
1
5
Number of shares used for basic EPS computation
2,053
561
1,798
622
667
1,339
Basic EPS
$
1.12
$
1.12
$
0.62
$
0.62
$
0.02
$
0.02
Diluted EPS:
Numerator
Net income attributable to common stockholders
$
2,296
$
629
$
1,107
$
384
$
11
$
21
Reallocation of net income attributable to participating securities
15
—
9
—
—
—
Reallocation of net income as a result of conversion of Class B to Class A
common stock
629
—
384
—
21
—
Reallocation of net income to Class B common stock —
23
—
39
—
1
Net income attributable to common stockholders for diluted EPS
$
2,940
$
652
$
1,500
$
423
$
32
$
22
Denominator
Number of shares used for basic EPS computation
2,053
561
1,798
622
667
1,339
Conversion of Class B to Class A common stock
561
—
622
—
1,339
—
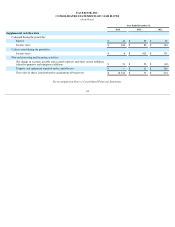
Weighted average effect of dilutive securities:
Employee stock options
13
13
65
65
134
134
RSUs
30
13
25
15
23
23
Shares subject to repurchase
7
4
7
7
3
3
Number of shares used for diluted EPS computation
2,664
591
2,517
709
2,166
1,499
Diluted EPS
$
1.10
$
1.10
$
0.60
$
0.60
$
0.01
$
0.01