Facebook 2014 Annual Report Download - page 49
Download and view the complete annual report
Please find page 49 of the 2014 Facebook annual report below. You can navigate through the pages in the report by either clicking on the pages listed below, or by using the keyword search tool below to find specific information within the annual report.-
 1
1 -
2
-
3
-
4
-
5
-
6
-
7
-
8
-
9
-
10
-
11
-
12
-
13
-
14
-
15
-
16
-
17
-
18
-
19
-
20
-
21
-
22
-
23
-
24
-
25
-
26
-
27
-
28
-
29
-
30
-
31
-
32
-
33
-
34
-
35
-
36
-
37
-
38
-
 39
39 -
 40
40 -
 41
41 -
 42
42 -
 43
43 -
 44
44 -
 45
45 -
 46
46 -
 47
47 -
 48
48 -
 49
49 -
 50
50 -
 51
51 -
 52
52 -
 53
53 -
 54
54 -
 55
55 -
 56
56 -
 57
57 -
 58
58 -
 59
59 -
60
-
61
-
62
-
63
-
64
-
65
-
66
-
67
-
68
-
69
-
70
-
71
-
72
-
73
-
74
-
75
-
76
-
77
-
78
-
79
-
80
-
81
-
82
-
83
-
84
-
85
-
86
-
87
-
88
-
89
-
90
-
91
-
92
-
93
-
94
-
95
-
96
-
97
-
98
-
99
-
100
-
101
-
102
-
103
-
104
-
105
-
106
-
107
-
108
-
109
-
110
-
111
-
112
-
113
-
114
-
115
-
116
-
117
-
118
-
119
-
120
-
121
-
122
-
123
-
124
-
125
-
126
-
127
-
128
 |
 |

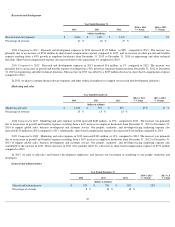
2014 Compared to 2013 . General and administrative expenses in 2014 increased $192 million , or 25% , compared to 2013
. The increase was
primarily due to an increase in payroll and benefits expenses resulting from a 55% increase in employee headcount. Share-
based compensation expense
also increased $71 million
compared to 2013. Additionally, professional services expense in 2014 also increased $58 million primarily due to higher
consulting and other professional service fees.
2013 Compared to 2012 .
General and administrative expenses in 2013 decreased $111 million, or 12%, compared to 2012. The decrease was
primarily due to a $208 million decrease in share-
based compensation expense in 2013 compared to 2012. The decrease in 2013 was partially offset by
increased payroll and benefits expense resulting from a 19% increase in employee headcount and increased amortization of acquired patents.
In 2015, we plan to increase general and administrative employee headcount to support overall company growth.
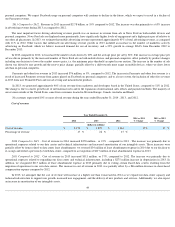
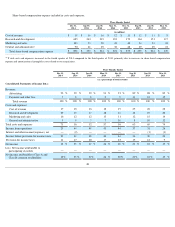
Interest and other income/(expense), net
2014 Compared to 2013 . Interest and other income/(expense), net in 2014 decreased $34 million , or 68% , compared to 2013 . Other income/
(expense), net decreased primarily due to $87 million in foreign exchange losses resulting from the periodic re-
measurement of our foreign currency
balances. The decrease in other income/(expense), net was partially offset by a decrease in interest expense due to the repayment of our long-
term debt
in August 2013 and lower capital lease payments.
2013 Compared to 2012 . Interest and other income/(expense), net in 2013 decreased $6 million, or 14%, compared to 2012. Other income/
(expense), net decreased primarily due to foreign exchange losses resulting from the periodic re-
measurement of our foreign currency balances. In
addition, interest expense increased by $5 million primarily due to interest on the $1.5 billion term loan that was drawn down in the fourth quarter of
2012 and fully repaid in August 2013, offset by an increase in interest income resulting from higher invested cash balances.
Provision for income taxes
2014 Compared to 2013 . Our provision for income taxes in 2014 increased $716 million , or 57% , compared to 2013
, primarily due to an
increase in income before provision for income taxes. Our effective tax rate differs from the statutory rate due to non-deductible share-
based
compensation, operations in jurisdictions with tax rates lower than the U.S., and tax research credits. Our effective tax rate decreased primarily due to a
change in our geographic mix of pre-tax income.
2013 Compared to 2012 .
Our provision for income taxes in 2013 increased $813 million, or 184%, compared to 2012, primarily due to an
increase in income before provision for income taxes. Our effective tax rate decreased primarily due to a lower amount of non-deductible share-
based
compensation. Our effective tax rate in 2013 was also lower due to the reinstatement in 2013 of the federal tax credit for research and development
activities. We recognized the benefit from the reinstatement of the tax credit for 2012 and 2013 during the year ended December 31, 2013.
46
Year Ended December 31,
2014
2013
2012
2014 vs 2013
% Change
2013 vs 2012
% Change
(in millions)
Interest income/(expense), net
$
4
$
(37
)
$
(37
)
111
%
—
%
Other income/(expense), net
(88
)
(13
)
(7
)
(577
)%
(86
)%
Interest and other income/(expense), net
$
(84
)
$
(50
)
$
(44
)
(68
)%
(14
)%
Year Ended December 31,
2014
2013
2012
2014 vs 2013
% Change
2013 vs 2012
% Change
(dollars in millions)
Provision for income taxes
$
1,970
$
1,254
$
441
57
%
184
%
Effective tax rate
40
%
46
%
89
%