Facebook 2014 Annual Report Download - page 51
Download and view the complete annual report
Please find page 51 of the 2014 Facebook annual report below. You can navigate through the pages in the report by either clicking on the pages listed below, or by using the keyword search tool below to find specific information within the annual report.-
 1
1 -
2
-
3
-
4
-
5
-
6
-
7
-
8
-
9
-
10
-
11
-
12
-
13
-
14
-
15
-
16
-
17
-
18
-
19
-
20
-
21
-
22
-
23
-
24
-
25
-
26
-
27
-
28
-
29
-
30
-
31
-
32
-
33
-
34
-
35
-
36
-
37
-
38
-
39
-
40
-
 41
41 -
 42
42 -
 43
43 -
 44
44 -
 45
45 -
 46
46 -
 47
47 -
 48
48 -
 49
49 -
 50
50 -
 51
51 -
 52
52 -
 53
53 -
 54
54 -
 55
55 -
 56
56 -
 57
57 -
 58
58 -
 59
59 -
 60
60 -
 61
61 -
62
-
63
-
64
-
65
-
66
-
67
-
68
-
69
-
70
-
71
-
72
-
73
-
74
-
75
-
76
-
77
-
78
-
79
-
80
-
81
-
82
-
83
-
84
-
85
-
86
-
87
-
88
-
89
-
90
-
91
-
92
-
93
-
94
-
95
-
96
-
97
-
98
-
99
-
100
-
101
-
102
-
103
-
104
-
105
-
106
-
107
-
108
-
109
-
110
-
111
-
112
-
113
-
114
-
115
-
116
-
117
-
118
-
119
-
120
-
121
-
122
-
123
-
124
-
125
-
126
-
127
-
128
 |
 |
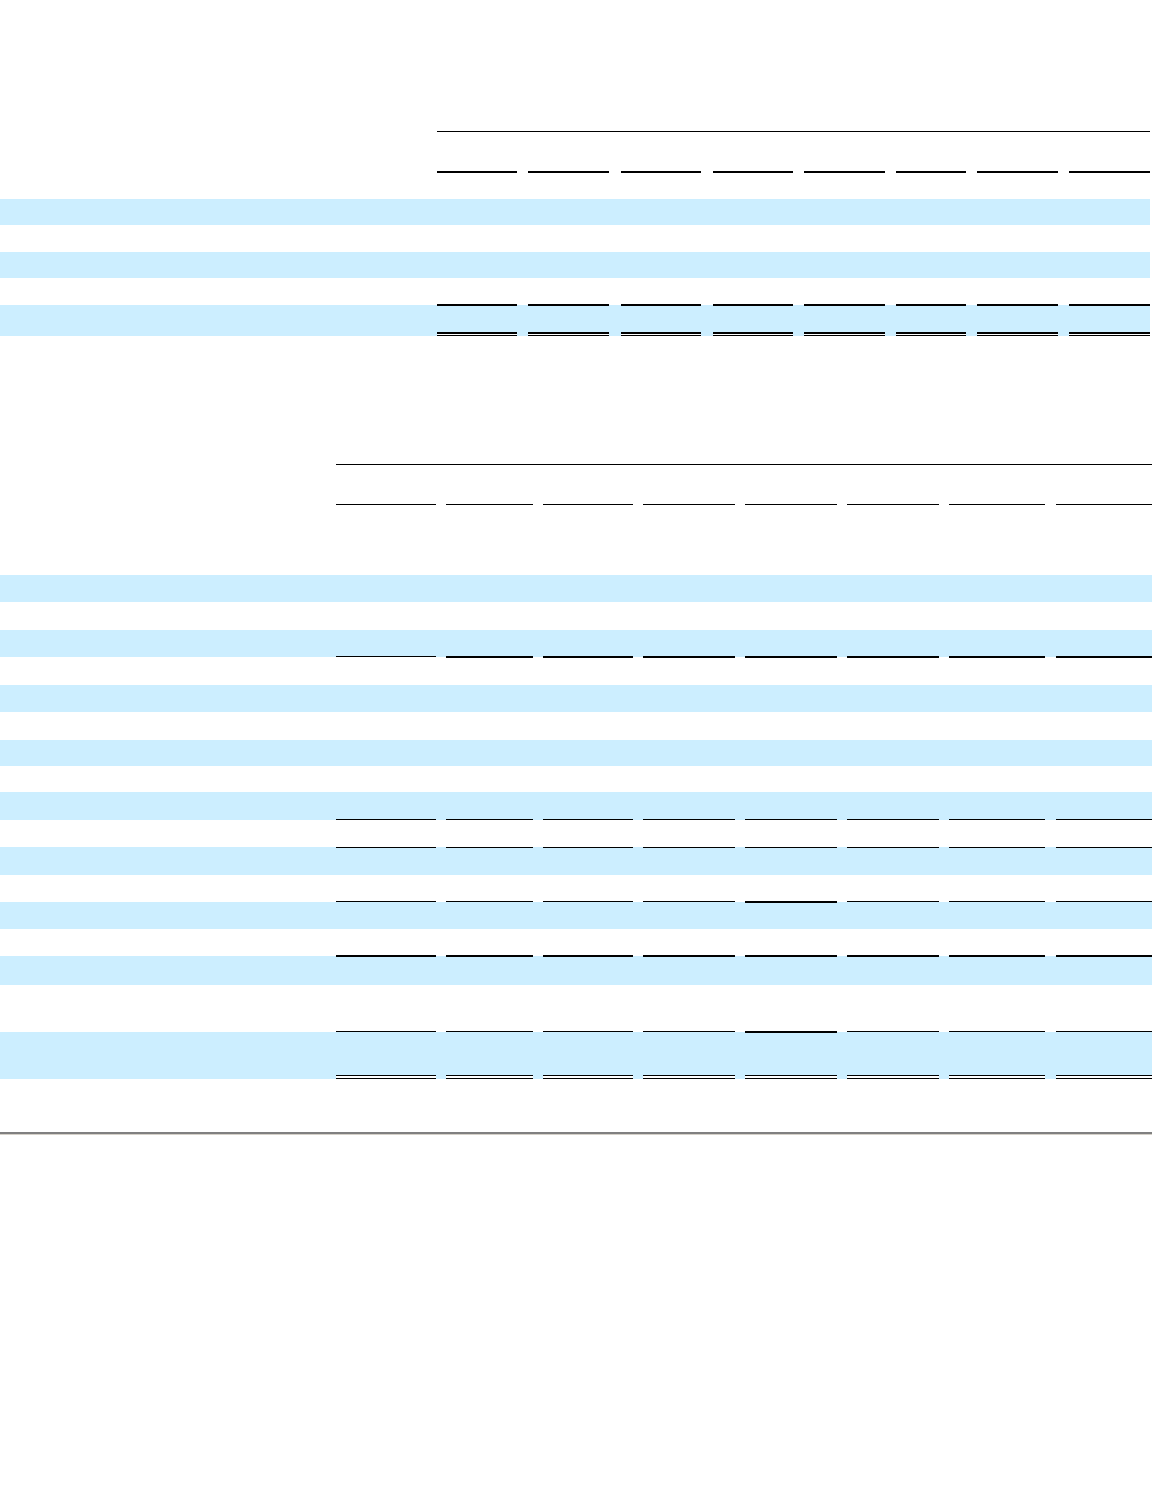
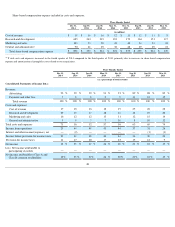
Share-based compensation expense included in costs and expenses:
_________________________
(1)
T otal costs and expenses increased in the fourth quarter of 2014 compared to the third quarter of 2014, primarily due to increases in share-
based compensation
expense and amortization of intangible assets related to our acquisitions.
48
Three Months Ended
Dec 31,
2014
Sep 30,
2014
Jun 30,
2014
Mar 31,
2014
Dec 31,
2013
Sep 30,
2013
Jun 30,
2013
Mar 31,
2013
(in millions)
Cost of revenue
$
18
$
16
$
16
$
12
$
11
$
12
$
11
$
8
Research and development
685
243
219
181
172
164
151
117
Marketing and sales
103
53
50
43
42
34
33
24
General and administrative
90
41
29
38
48
29
29
21
Total share-based compensation expense
$
896
$
353
$
314
$
274
$
273
$
239
$
224
$
170
Three Months Ended
Dec 31,
2014
Sep 30,
2014
Jun 30,
2014
Mar 31,
2014
Dec 31,
2013
Sep 30,
2013
Jun 30,
2013
Mar 31,
2013
(as a percentage of total revenue)
Consolidated Statements of Income Data:
Revenue:
Advertising
93
%
92
%
92
%
91
%
91
%
89
%
88
%
85
%
Payments and other fees
7
8
8
9
9
11
12
15
Total revenue
100
%
100
%
100
%
100
%
100
%
100
%
100
%
100
%
Costs and expenses:
Cost of revenue
17
18
16
18
19
25
26
28
Research and development
29
19
17
18
16
18
19
20
Marketing and sales
16
12
12
13
11
12
15
14
General and administrative
9
8
7
7
10
8
10
12
Total costs and expenses
71
56
52
57
56
63
69
74
Income from operations
29
44
48
43
44
37
31
26
Interest and other income/(expense), net
—
(
2
)
—
—
—
—
(
1
)
(1
)
Income before provision for income taxes
29
42
48
43
44
36
30
24
Provision for income taxes
11
17
20
17
23
15
12
9
Net income
18
%
25
%
27
%
26
%
20
%
21
%
18
%
15
%
Less: Net income attributable to
participating securities
—
—
—
—
—
—
—
—
Net income attributable to Class A and
Class B common stockholders
18
%
25
%
27
%
26
%
20
%
21
%
18
%
15
%