Facebook 2014 Annual Report Download - page 52
Download and view the complete annual report
Please find page 52 of the 2014 Facebook annual report below. You can navigate through the pages in the report by either clicking on the pages listed below, or by using the keyword search tool below to find specific information within the annual report.-
 1
1 -
2
-
3
-
4
-
5
-
6
-
7
-
8
-
9
-
10
-
11
-
12
-
13
-
14
-
15
-
16
-
17
-
18
-
19
-
20
-
21
-
22
-
23
-
24
-
25
-
26
-
27
-
28
-
29
-
30
-
31
-
32
-
33
-
34
-
35
-
36
-
37
-
38
-
39
-
40
-
41
-
 42
42 -
 43
43 -
 44
44 -
 45
45 -
 46
46 -
 47
47 -
 48
48 -
 49
49 -
 50
50 -
 51
51 -
 52
52 -
 53
53 -
 54
54 -
 55
55 -
 56
56 -
 57
57 -
 58
58 -
 59
59 -
 60
60 -
 61
61 -
 62
62 -
63
-
64
-
65
-
66
-
67
-
68
-
69
-
70
-
71
-
72
-
73
-
74
-
75
-
76
-
77
-
78
-
79
-
80
-
81
-
82
-
83
-
84
-
85
-
86
-
87
-
88
-
89
-
90
-
91
-
92
-
93
-
94
-
95
-
96
-
97
-
98
-
99
-
100
-
101
-
102
-
103
-
104
-
105
-
106
-
107
-
108
-
109
-
110
-
111
-
112
-
113
-
114
-
115
-
116
-
117
-
118
-
119
-
120
-
121
-
122
-
123
-
124
-
125
-
126
-
127
-
128
 |
 |
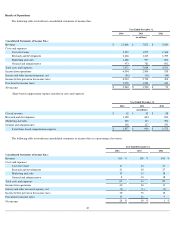
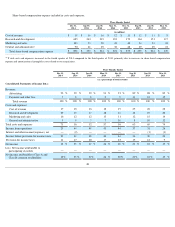
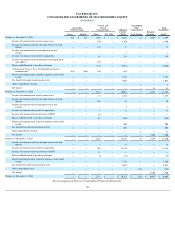
Share-based compensation expense included in costs and expenses:
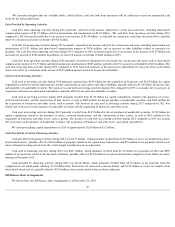
Liquidity and Capital Resources
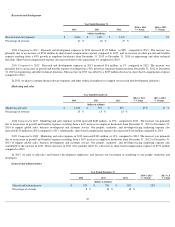
Our principal sources of liquidity are our cash and cash equivalents, marketable securities, and cash generated from operations. Cash and cash
equivalents and marketable securities consist primarily of cash on deposit with banks, investments in money market funds, and investments in U.S.
government securities, U.S. government agency securities, and corporate debt securities. Cash and cash equivalents and marketable securities were
$11.20 billion as of December 31, 2014 , a decrease of $250 million from December 31, 2013 , primarily due to $4.98 billion
for acquisitions of
businesses and $2.50 billion
for other cash outflows mainly related to purchases of property and equipment. These decreases were partially offset by
$5.46 billion of cash generated from operations and $1.87 billion in excess tax benefit from share-based award activity.
In October 2014, the tax withholdings related to the WhatsApp vested merger consideration were funded by net share settlement. The amount
remitted to the tax authorities for the employees' tax obligation to the tax authorities was reflected as a financing activity within our consolidated
statements of cash flows.
In January 2014, we began requiring that employees sell a portion of the shares that they receive upon the vesting of RSUs in order to cover any
required withholding taxes ("sell-to-cover"), rather than our previous approach of net share settlement. This sell-to-
cover approach reduces our cash
outflows compared to the net share settlement approach.
In August 2013, we entered into a five-
year senior unsecured revolving credit facility (2013 Revolving Credit Facility) that allows us to borrow
up to $6.5 billion to fund working capital and general corporate purposes with interest payable on the borrowed amounts set at LIBOR plus 1.0%, as
well as an annual commitment fee of 0.10% on the daily undrawn balance of the facility. We paid origination fees at closing of the 2013 Revolving
Credit Facility, which fees are being amortized over the term of the facility. Any amounts outstanding under this facility will be due and payable on
August 15, 2018. As of December 31, 2014 , no amounts had been drawn down and we were in compliance with the covenants under this credit facility.
As of December 31, 2014 , $1.57 billion of the $11.20 billion
in cash and cash equivalents and marketable securities was held by our foreign
subsidiaries. Substantially all of these funds are in jurisdictions for which we are indefinitely reinvesting the earnings of the local subsidiary. These
subsidiaries have historically incurred losses; as such, repatriating the funds will likely incur no residual tax liability. We have provided residual taxes in
jurisdictions where we do not intend to indefinitely reinvest the earnings of the local subsidiary, however the amount of taxes provided has been
insignificant.
49
Three Months Ended
Dec 31,
2014
Sep 30,
2014
Jun 30,
2014
Mar 31,
2014
Dec 31,
2013
Sep 30,
2013
Jun 30,
2013
Mar 31,
2013
(as a percentage of total revenue)
Cost of revenue
—
%
—
%
1
%
—
%
—
%
1
%
1
%
1
%
Research and development
18
8
8
7
7
8
8
8
Marketing and sales
3
2
2
2
2
2
2
2
General and administrative
2
1
1
2
2
1
2
1
Total share-based compensation expense
23
%
11
%
11
%
11
%
11
%
12
%
12
%
12
%
Year Ended December 31,
2014
2013
2012
(in millions)
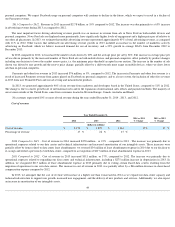
Consolidated Statements of Cash Flows Data:
Net cash provided by operating activities
$
5,457
$
4,222
$
1,612
Net cash used in investing activities
(5,913
)
(2,624
)
(7,024
)
Net cash provided by (used in) financing activities
1,571
(667
)
6,283
Purchases of property and equipment
(1,831
)
(1,362
)
(1,235
)
Depreciation and amortization
1,243
1,011
649
Share-based compensation
1,786
906
1,572