Facebook 2014 Annual Report Download - page 76
Download and view the complete annual report
Please find page 76 of the 2014 Facebook annual report below. You can navigate through the pages in the report by either clicking on the pages listed below, or by using the keyword search tool below to find specific information within the annual report.-
 1
1 -
2
-
3
-
4
-
5
-
6
-
7
-
8
-
9
-
10
-
11
-
12
-
13
-
14
-
15
-
16
-
17
-
18
-
19
-
20
-
21
-
22
-
23
-
24
-
25
-
26
-
27
-
28
-
29
-
30
-
31
-
32
-
33
-
34
-
35
-
36
-
37
-
38
-
39
-
40
-
41
-
42
-
43
-
44
-
45
-
46
-
47
-
48
-
49
-
50
-
51
-
52
-
53
-
54
-
55
-
56
-
57
-
58
-
59
-
60
-
61
-
62
-
63
-
64
-
65
-
 66
66 -
 67
67 -
 68
68 -
 69
69 -
 70
70 -
 71
71 -
 72
72 -
 73
73 -
 74
74 -
 75
75 -
 76
76 -
 77
77 -
 78
78 -
 79
79 -
 80
80 -
 81
81 -
 82
82 -
 83
83 -
 84
84 -
 85
85 -
 86
86 -
87
-
88
-
89
-
90
-
91
-
92
-
93
-
94
-
95
-
96
-
97
-
98
-
99
-
100
-
101
-
102
-
103
-
104
-
105
-
106
-
107
-
108
-
109
-
110
-
111
-
112
-
113
-
114
-
115
-
116
-
117
-
118
-
119
-
120
-
121
-
122
-
123
-
124
-
125
-
126
-
127
-
128
 |
 |
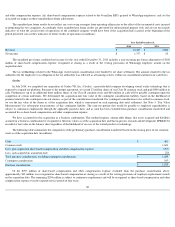
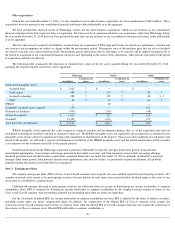
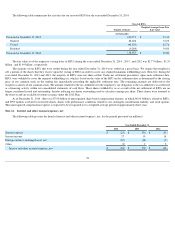
We classify our cash equivalents and marketable securities within Level 1 or Level 2 because we use quoted market prices or alternative pricing
sources and models utilizing market observable inputs to determine their fair value.
We classify our contingent consideration liability in connection with our acquisition of Oculus within Level 3 as factors used to develop the
estimated fair value are unobservable inputs that are not supported by market activity. We estimate the fair value of our contingent consideration liability
based on the present value of probability-weighted future cash flows related to the contingent earn-
out criteria and the fair value of our common stock on
each reporting date. Our fair value estimate of this liability was $169 million
at the date of acquisition and changes in the fair value of the contingent
consideration liability subsequent to the acquisition date, such as changes in the probability assessment and the fair value of our common stock, are
recognized in earnings in the period when the change in the estimated fair value occurs. During the year ended December 31, 2014
, we recognized a
$22 million
change in the fair value of our contingent consideration liability in research and development expense in our consolidated statements of
income primarily due to the change in the fair value of our common stock.
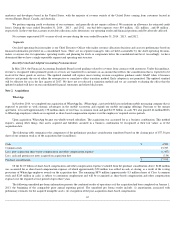
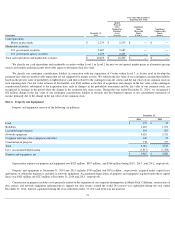
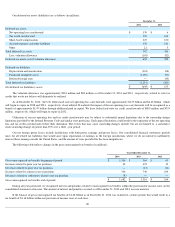
Property and equipment consists of the following (in millions):
Depreciation expense on property and equipment was $923 million , $857 million , and $566 million during 2014 , 2013 , and 2012
, respectively.
Property and equipment at December 31, 2014 and 2013 includes $700 million and $976 million
, respectively, acquired under capital lease
agreements of which the majority is included in network equipment. Accumulated depreciation of property and equipment acquired under these capital
leases was $425 million and $527 million at December 31, 2014 and 2013 , respectively.
Construction in progress includes costs primarily related to the expansion of our corporate headquarters in Menlo Park, California, construction of
data centers, and network equipment infrastructure to support our data centers around the world. No
interest was capitalized during the year ended
December 31, 2014 . Interest capitalized during the years ended December 31, 2013 and 2012 was not material.
72
Fair Value Measurement at
Reporting Date Using
Description
December 31,
2013
Quoted
Prices in
Active
Markets for
Identical
Assets
(Level 1)
Significant
Other
Observable
Inputs
(Level 2)
Significant
Unobservable
Inputs
(Level 3
Cash equivalents:
Money market funds
$
2,279
$
2,279
$
—
$
—
Marketable securities:
U.S. government securities
5,687
5,687
—
—
U.S. government agency securities
2,439
2,439
—
—
Total cash equivalents and marketable securities
$
10,405
$
10,405
$
—
$
—
Note 6.
Property and Equipment
December 31,
2014
2013
Land
$
153
$
45
Buildings
1,420
1,071
Leasehold improvements
304
203
Network equipment
3,020
2,351
Computer software, office equipment and other
149
95
Construction in progress
738
377
Total
5,784
4,142
Less: Accumulated depreciation
(1,817
)
(1,260
)
Property and equipment, net
$
3,967
$
2,882