Facebook 2014 Annual Report Download - page 34
Download and view the complete annual report
Please find page 34 of the 2014 Facebook annual report below. You can navigate through the pages in the report by either clicking on the pages listed below, or by using the keyword search tool below to find specific information within the annual report.-
 1
1 -
2
-
3
-
4
-
5
-
6
-
7
-
8
-
9
-
10
-
11
-
12
-
13
-
14
-
15
-
16
-
17
-
18
-
19
-
20
-
21
-
22
-
23
-
 24
24 -
 25
25 -
 26
26 -
 27
27 -
 28
28 -
 29
29 -
 30
30 -
 31
31 -
 32
32 -
 33
33 -
 34
34 -
 35
35 -
 36
36 -
 37
37 -
 38
38 -
 39
39 -
 40
40 -
 41
41 -
 42
42 -
 43
43 -
 44
44 -
45
-
46
-
47
-
48
-
49
-
50
-
51
-
52
-
53
-
54
-
55
-
56
-
57
-
58
-
59
-
60
-
61
-
62
-
63
-
64
-
65
-
66
-
67
-
68
-
69
-
70
-
71
-
72
-
73
-
74
-
75
-
76
-
77
-
78
-
79
-
80
-
81
-
82
-
83
-
84
-
85
-
86
-
87
-
88
-
89
-
90
-
91
-
92
-
93
-
94
-
95
-
96
-
97
-
98
-
99
-
100
-
101
-
102
-
103
-
104
-
105
-
106
-
107
-
108
-
109
-
110
-
111
-
112
-
113
-
114
-
115
-
116
-
117
-
118
-
119
-
120
-
121
-
122
-
123
-
124
-
125
-
126
-
127
-
128
 |
 |

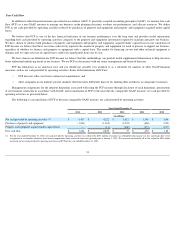
Free Cash Flow
In addition to other financial measures presented in accordance with U.S. generally accepted accounting principles (GAAP), we monitor free cash
flow (FCF) as a non-
GAAP measure to manage our business, make planning decisions, evaluate our performance, and allocate resources. We define
FCF as net cash provided by operating activities reduced by purchases of property and equipment and property and equipment acquired under capital
leases.
We believe that FCF is one of the key financial indicators of our business performance over the long term and provides useful information
regarding how cash provided by operating activities compares to the property and equipment investments required to maintain and grow our business.
We have chosen to subtract both purchases of property and equipment and property and equipment acquired under capital leases in our calculation of
FCF because we believe that these two items collectively represent the amount of property and equipment we need to procure to support our business,
regardless of whether we finance such property or equipment with a capital lease. The market for financing servers and other technical equipment is
dynamic and we expect our use of capital leases could vary significantly from year to year.
We have chosen our definition for FCF because we believe that this methodology can provide useful supplemental information to help investors
better understand underlying trends in our business. We use FCF in discussions with our senior management and board of directors.
FCF has limitations as an analytical tool, and you should not consider it in isolation or as a substitute for analysis of other GAAP financial
measures, such as net cash provided by operating activities. Some of the limitations of FCF are:
Management compensates for the inherent limitations associated with using the FCF measure through disclosure of such limitations, presentation
of our financial statements in accordance with GAAP, and reconciliation of FCF to the most directly comparable GAAP measure, net cash provided by
operating activities, as presented below.
The following is a reconciliation of FCF to the most comparable GAAP measure, net cash provided by operating activities:
31
•
FCF does not reflect our future contractual commitments; and
•
other companies in our industry present similarly titled measures differently than we do, limiting their usefulness as comparative measures.
Year Ended December 31,
2014
2013
2012
2011
2010
(in millions)
Net cash provided by operating activities
(1)
$
5,457
$
4,222
$
1,612
$
1,549
$
698
Purchases of property and equipment
(1,831
)
(1,362
)
(1,235
)
(606
)
(293
)
Property and equipment acquired under capital leases
—
(
11
)
(340
)
(473
)
(217
)
Free cash flow
$
3,626
$
2,849
$
37
$
470
$
188
(1)
For the year ended December 31, 2012, net cash provided by operating activities was reduced by $451 million of income tax refundable from income tax loss carrybacks due to the
recognition of tax benefits related to share-
based compensation from restricted stock units granted prior to January 1, 2011. We received substantially all of this refund in 2013 which
increased our net cash provided by operating activities and FCF for the year ended December 31, 2013.