Lowe's 2010 Annual Report Download - page 23
Download and view the complete annual report
Please find page 23 of the 2010 Lowe's annual report below. You can navigate through the pages in the report by either clicking on the pages listed below, or by using the keyword search tool below to find specific information within the annual report.-
 1
1 -
2
-
3
-
4
-
5
-
6
-
7
-
8
-
9
-
10
-
11
-
12
-
 13
13 -
 14
14 -
 15
15 -
 16
16 -
 17
17 -
 18
18 -
 19
19 -
 20
20 -
 21
21 -
 22
22 -
 23
23 -
 24
24 -
 25
25 -
 26
26 -
 27
27 -
 28
28 -
 29
29 -
 30
30 -
 31
31 -
 32
32 -
 33
33 -
34
-
35
-
36
-
37
-
38
-
39
-
40
-
41
-
42
-
43
-
44
-
45
-
46
-
47
-
48
-
49
-
50
-
51
-
52
-
53
-
54
-
55
-
56
-
57
-
58
 |
 |

LOWE’S 2010 ANNUAL REPORT 19
to new content, online communities, project planning and product
subscriptions,weexpecttoincreaseourinvolvementintheirhome
improvementexperiences,whichwillleadtoincreasedsales.
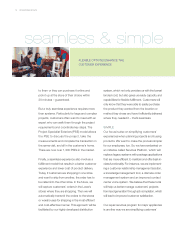
To further meet our customers’ desire for a simplified and
seamlessexperience,welaunchedourrepairservicesprograminthe
second half of 2010 to provide after-sale service on major appliances.
Byhavinggreatercontroloverthisservice,weexpectmorepositive
customerexperiences,whichwillhelpdriveincrementalrepeatbusiness
andadditionalpurchasesacrossthestore.Wealsoexpecttorealize
cost savings through lower appliance return rates and identification
of quality concerns that we can work with our vendors to resolve.
Improving efficiency and controlling costs
During 2010, we implemented additional programs in our operations,
supply chain and customer support centers to increase operational
efficiency and control costs. Late in 2010, we modified a portion of
our mid-level store management structure from a tiered structure into
a single-level Assistant Store Manager position. On average, this
change resulted in a reduction of one management position per store.
Although the primary purpose of this change was to make our store
management structure more effective by fully empowering our Assistant
Store Managers to drive the business, the net savings from these
changes will also largely offset the cost of 2011 wage increases.
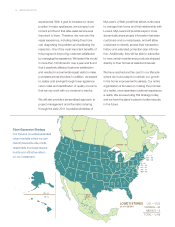
To further drive operational efficiency and profitable sales, we are
focused on providing the right products in the right markets at the right
price. During 2010, we implemented two important changes to our
pricing strategy. First, we increased our number of competitive pricing
zones, from under 90 to more than 210, allowing us to price products
more competitively in each market. Second, we implemented Base
Price Optimization, which determines the best price, by item and
competitive pricing zone, to improve price perception and profitability.
Theseinitiativeshelpedtodrivemarginincreasesofapproximately
25 basis points for the third and fourth fiscal quarters of 2010 as
compared to the same quarters in 2009.
In 2011, we will also begin implementing Integrated Planning
andExecution(IP&E),whichwillhelpusmorespecicallydetermine
what products and quantities to offer in each store based on market
demographics, customer requirements, customer shopping prefer-
encesandlocalstoreemployeeknowledge.Weexpectthisinitiative
to enable us to better align with customer demand while managing
our inventory levels.
Overthepastsixyears,wehavealsorenedoursupplychain,
which resulted in increased trailer utilization, an elimination of over
550 million road miles on a comparable volume basis and a high
number of mode conversions from truckload to intermodal routings.
These combined changes resulted in savings of over 100 million
gallonsofdieselfuelandoverallsavingsofapproximately$490million
overthesix-yearperiod.
Tobetterleverageourexistingresourcesandcapabilitiesatour
customer support centers, during 2010 we significantly reduced the
use of third-party information technology (IT) service technicians to
makeonsiterepairsinourstoresbyleveragingexistingITsupport
teams to manage the process. By shipping replacement parts to
stores and repairing returned defective units in our technology service
centerweexpectongoingsavingsofapproximately$14million
per year.
We are focused on making the promise of a better, simpler customer
experienceareality.Weknowthereareopportunitiestogrowour
business through deeper customer relationships. We will continue to
focus on driving profitable sales, market share growth and controlling
costs while recommitting to our vision to deliver customer-valued
solutions that make Lowe’s the first choice in home improvement.
OPERATIONS
The following tables set forth the percentage relationship to net sales
of each line item of the consolidated statements of earnings, as well as
the percentage change in dollar amounts from the prior year. This table
should be read in conjunction with the following discussion and analysis
and the consolidated financial statements, including the related notes
to the consolidated financial statements.
Basis Point Percentage
Increase/ Increase/
(Decrease) (Decrease)
in Percentage in Dollar
of Net Sales Amounts
from from
Prior Year Prior Year
2010 vs. 2010 vs.
2010 2009 2009 2009
Net sales 100.00% 100.00% N/A 3.4%
Gross margin 35.14 34.86 28 4.2
Expenses:
Selling, general and
administrative 24.60 24.85 (25) 2.3
Depreciation 3.25 3.42 (17) (1.7)
Interest – net 0.68 0.61 7 15.7
Total expenses 28.53 28.88 (35) 2.1
Pre-tax earnings 6.61 5.98 63 14.2
Incometaxprovision 2.49 2.20 29 16.9
Net earnings 4.12% 3.78% 34 12.7%
EBIT margin 1 7.29% 6.59% 70 14.4%
Basis Point Percentage
Increase/ Increase/
(Decrease) (Decrease)
in Percentage in Dollar
of Net Sales Amounts
from from
Prior Year Prior Year
2009 vs. 2009 vs.
2009 2008 2008 2008
Net sales 100.00% 100.00% N/A (2.1)%
Gross margin 34.86 34.21 65 (0.2)
Expenses:
Selling, general and
administrative 24.85 23.17 168 5.0
Depreciation 3.42 3.19 23 4.9
Interest – net 0.61 0.58 3 2.4
Total expenses 28.88 26.94 194 4.9
Pre-tax earnings 5.98 7.27 (129) (19.4)
Incometaxprovision 2.20 2.72 (52) (20.5)
Net earnings 3.78% 4.55% (77) (18.8)%
EBIT margin 1 6.59% 7.85% (126) (17.8)%