Lowe's 2010 Annual Report Download - page 51
Download and view the complete annual report
Please find page 51 of the 2010 Lowe's annual report below. You can navigate through the pages in the report by either clicking on the pages listed below, or by using the keyword search tool below to find specific information within the annual report.-
 1
1 -
2
-
3
-
4
-
5
-
6
-
7
-
8
-
9
-
10
-
11
-
12
-
13
-
14
-
15
-
16
-
17
-
18
-
19
-
20
-
21
-
22
-
23
-
24
-
25
-
26
-
27
-
28
-
29
-
30
-
31
-
32
-
33
-
34
-
35
-
36
-
37
-
38
-
39
-
40
-
 41
41 -
 42
42 -
 43
43 -
 44
44 -
 45
45 -
 46
46 -
 47
47 -
 48
48 -
 49
49 -
 50
50 -
 51
51 -
 52
52 -
 53
53 -
 54
54 -
 55
55 -
 56
56 -
 57
57 -
 58
58
 |
 |

LOWE’S 2010 ANNUAL REPORT 47
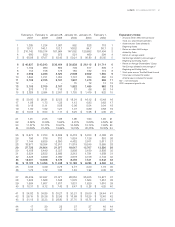
Alabama 39
Alaska 6
Arizona 32
Arkansas 20
California 109
Colorado 28
Connecticut 16
Delaware 10
Florida 118
Georgia 64
Hawaii 3
Idaho 8
Illinois 41
Indiana 44
Iowa 11
Kansas 11
Kentucky 42
Louisiana 32
Maine 13
Maryland 29
Massachusetts 28
Michigan 48
Minnesota 13
Mississippi 24
Missouri 45
Montana 5
Nebraska 5
Nevada 17
New Hampshire 16
New Jersey 40
NewMexico 13
New York 66
North Carolina 111
North Dakota 3
Ohio 83
Oklahoma 29
Oregon 13
Pennsylvania 79
Rhode Island 6
South Carolina 48
South Dakota 3
Tennessee 60
Texas 141
Utah 16
Vermont 2
Virginia 68
Washington 37
West Virginia 18
Wisconsin 9
Wyoming 1
Total U.S. Stores
1,723
Alberta, CAN 2
Ontario, CAN
22
Total CAN Stores
24
Nuevo Leon, MX 2
Total Stores
1,749
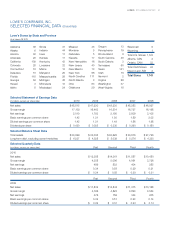
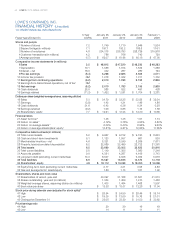
LOWE’S COMPANIES, INC.
SELECTED FINANCIAL DATA (Unaudited)
Lowe’s Stores by State and Province
(As of January 28, 2011)
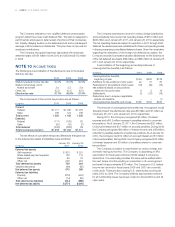
Selected Statement of Earnings Data
(Inmillions,exceptpersharedata) 2010 2009 2008 2007 2006
Netsales $48,815 $47,220 $48,230 $48,283 $46,927
Gross margin 17,152 16,463 16,501 16,727 16,198
Net earnings 2,010 1,783 2,195 2,809 3,105
Basic earnings per common share 1.42 1.21 1.50 1.89 2.02
Diluted earnings per common share 1.42 1.21 1.49 1.86 1.98
Dividendspershare $ 0.420 $ 0.355 $ 0.335 $ 0.290 $ 0.180
Selected Balance Sheet Data
Totalassets $33,699 $33,005 $32,625 $30,816 $27,726
Long-termdebt,excludingcurrentmaturities $ 6,537 $ 4,528 $ 5,039 $ 5,576 $ 4,325
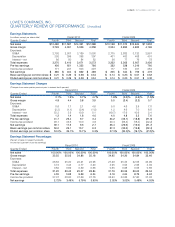
Selected Quarterly Data
(Inmillions,exceptpersharedata) First Second Third Fourth
2010
Netsales $12,388 $14,361 $11,587 $10,480
Gross margin 4,358 5,006 4,061 3,726
Net earnings 489 832 404 285
Basic earnings per common share 0.34 0.58 0.29 0.21
Dilutedearningspercommonshare $ 0.34 $ 0.58 $ 0.29 $ 0.21
First Second Third Fourth
2009
Netsales $11,832 $13,844 $11,375 $10,168
Gross margin 4,196 4,823 3,890 3,554
Net earnings 476 759 344 205
Basic earnings per common share 0.32 0.51 0.23 0.14
Diluted earnings per
common
share $ 0.32 $ 0.51 $ 0.23 $ 0.14