Lowe's 2010 Annual Report Download - page 53
Download and view the complete annual report
Please find page 53 of the 2010 Lowe's annual report below. You can navigate through the pages in the report by either clicking on the pages listed below, or by using the keyword search tool below to find specific information within the annual report.-
 1
1 -
2
-
3
-
4
-
5
-
6
-
7
-
8
-
9
-
10
-
11
-
12
-
13
-
14
-
15
-
16
-
17
-
18
-
19
-
20
-
21
-
22
-
23
-
24
-
25
-
26
-
27
-
28
-
29
-
30
-
31
-
32
-
33
-
34
-
35
-
36
-
37
-
38
-
39
-
40
-
41
-
42
-
 43
43 -
 44
44 -
 45
45 -
 46
46 -
 47
47 -
 48
48 -
 49
49 -
 50
50 -
 51
51 -
 52
52 -
 53
53 -
 54
54 -
 55
55 -
 56
56 -
 57
57 -
 58
58
 |
 |

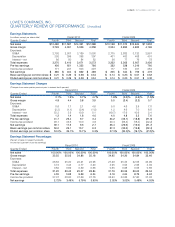
LOWE’S 2010 ANNUAL REPORT 49
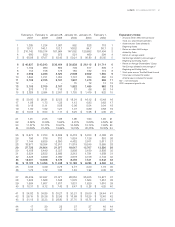
Earnings Statements
(Inmillions,exceptpersharedata) Fiscal 2010 Fiscal 2009
Quarter Ended Fourth Third Second First Fourth Third Second First
Net sales $10,480 $11,587 $14,361 $12,388 $10,168 $11,375 $13,844 $11,832
Gross margin 3,726 4,061 5,006 4,358 3,554 3,890 4,823 4,196
Expenses:
SG&A 2,792 2,931 3,189 3,093 2,775 2,882 3,123 2,957
Depreciation 392 399 398 397 401 403 408 401
Interest – net 86 80 84 82 56 77 76 78
Total expenses 3,270 3,410 3,671 3,572 3,232 3,362 3,607 3,436
Pre-tax earnings 456 651 1,335 786 322 528 1,216 760
Incometaxprovision 171 247 503 297 117 184 457 284
Net earnings $ 285 $ 404 $ 832 $ 489 $ 205 $ 344 $ 759 $ 476
Basic earnings per common share $ 0.21 $ 0.29 $ 0.58 $ 0.34 $ 0.14 $ 0.23 $ 0.51 $ 0.32
Diluted earnings per common share $ 0.21 $ 0.29 $ 0.58 $ 0.34 $ 0.14 $ 0.23 $ 0.51 $ 0.32
Earnings Statement Changes
(Changes from same quarter previous year, to nearest tenth percent)
Fiscal 2010 Fiscal 2009
Quarter Ended Fourth Third Second First Fourth Third Second First
Net sales 3.1% 1.9% 3.7% 4.7% 1.8% (3.0)% (4.6)% (1.5)%
Gross margin 4.8 4.4 3.8 3.9 5.5 (2.4) (3.2) 0.7
Expenses:
SG&A 0.6 1.7 2.1 4.6 5.0 4.6 2.9 7.8
Depreciation (2.3) (1.1) (2.4) (1.0) 1.2 4.6 7.0 6.8
Interest – net 53.3 3.9 10.9 5.1 (19.7) 17.6 10.6 2.4
Total expenses 1.2 1.4 1.8 4.0 4.0 4.8 3.5 7.6
Pre-tax earnings 41.7 23.4 9.7 3.4 24.2 (32.1) (18.8) (21.9)
Incometaxprovision 46.1 34.6 10.0 4.6 20.4 (36.4) (18.3) (22.2)
Net earnings 39.1 17.5 9.6 2.7 26.4 (29.6) (19.0) (21.7)
Basic earnings per common share 50.0 26.1 13.7 6.3 27.3 (30.0) (19.8) (22.4)
Diluted earnings per common share 50.0% 26.1% 13.7% 6.3% 27.3% (30.3)% (19.1)% (21.5)%
Earnings Statement Percentages
(Percent of sales to nearest hundredth;
incometaxispercentofpre-taxearnings)
Fiscal 2010 Fiscal 2009
Quarter Ended Fourth Third Second First Fourth Third Second First
Net sales 100.00% 100.00% 100.00% 100.00% 100.00% 100.00% 100.00% 100.00%
Gross margin 35.55 35.05 34.86 35.18 34.95 34.20 34.84 35.46
Expenses:
SG&A 26.64 25.30 22.21 24.98 27.29 25.34 22.55 24.99
Depreciation 3.74 3.44 2.77 3.20 3.95 3.54 2.95 3.39
Interest – net 0.82 0.69 0.59 0.66 0.55 0.68 0.55 0.66
Total expenses 31.20 29.43 25.57 28.84 31.79 29.56 26.05 29.04
Pre-tax earnings 4.35 5.62 9.29 6.34 3.16 4.64 8.79 6.42
Incometaxprovision 37.37 38.00 37.69 37.76 36.23 34.86 37.60 37.38
Net earnings 2.72% 3.49% 5.79% 3.95% 2.02% 3.02% 5.48% 4.02%
LOWE’S COMPANIES, INC.
QUARTERLY REVIEW OF PERFORMANCE (Unaudited)