Lowe's 2010 Annual Report Download - page 54
Download and view the complete annual report
Please find page 54 of the 2010 Lowe's annual report below. You can navigate through the pages in the report by either clicking on the pages listed below, or by using the keyword search tool below to find specific information within the annual report.-
 1
1 -
2
-
3
-
4
-
5
-
6
-
7
-
8
-
9
-
10
-
11
-
12
-
13
-
14
-
15
-
16
-
17
-
18
-
19
-
20
-
21
-
22
-
23
-
24
-
25
-
26
-
27
-
28
-
29
-
30
-
31
-
32
-
33
-
34
-
35
-
36
-
37
-
38
-
39
-
40
-
41
-
42
-
43
-
 44
44 -
 45
45 -
 46
46 -
 47
47 -
 48
48 -
 49
49 -
 50
50 -
 51
51 -
 52
52 -
 53
53 -
 54
54 -
 55
55 -
 56
56 -
 57
57 -
 58
58
 |
 |

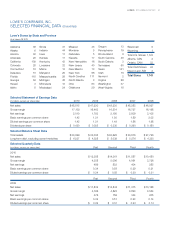
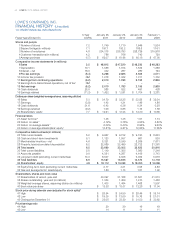
50 LOWE’S 2010 ANNUAL REPORT
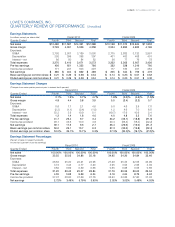
LOWE’S COMPANIES, INC.
FINANCIAL HISTORY (Unaudited)
10-YEAR FINANCIAL INFORMATION
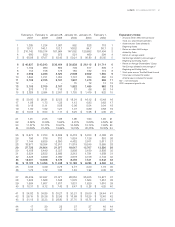
1
5-Year January 28, January 29, January 30, February 1,
Fiscal Years Ended On CGR% 2011 2010 2009 2008
Stores and people
1 Number of stores 7.2 1,749 1,710 1,649 1,534
2 Square footage (in millions) 7.1 197.1 193.2 186.6 174.1
3 Number of employees 4.8 234,318 238,793 228,729 215,978
4 Customer transactions (in millions) 4.2 786 766 740 720
5Averagepurchase (1.7) $ 62.07 $ 61.66 $ 65.15 $ 67.05 5 $ 68.98 $ 67.67 $ 63.43 $ 59.21 $ 56.80 $ 55.05 5
Comparative income statements (in millions)
6 Sales 2.5 $ 48,815 $ 47,220 $ 48,230 $ 48,283
7 Depreciation 10.1 1,586 1,614 1,539 1,366
8 Interest – net 16.0 332 287 280 194
9 Pre-tax earnings (6.4) 3,228 2,825 3,506 4,511
10Incometaxprovision NM 1,218 1,042 1,311 1,702 10 1,893 1,731 1,353 1,101 889 566 10
11 Earnings from continuing operations (6.2) 2,010 1,783 2,195 2,809
12Earningsfromdiscontinuedoperations,netoftax
1 NM – – – –
13 Net earnings (6.2) 2,010 1,783 2,195 2,809
14 Cash dividends 28.0 588 522 491 428
15Earningsretained (11.3) $ 1,422 $ 1,261 $ 1,704 $ 2,381 15 $ 2,829 $ 2,594 $ 2,051 $ 1,735 $ 1,419 $ 922 15
Dollars per share (weighted-average shares, assuming dilution)
16Sales 5.3 $ 34.79 $ 32.25 $ 32.85 $ 32.04 16 $ 30.00 $ 26.91 $ 22.55 $ 18.91 $ 16.12 $ 13.49 16
17 Earnings (3.9) 1.42 1.21 1.49 1.86
18 Cash dividends 31.6 0.42 0.36 0.34 0.28
19 Earnings retained (9.2) 1.00 0.85 1.15 1.58
20Shareholders’equity 7.7 $ 12.91 $ 13.03 $ 12.30 $ 10.68 20 $ 10.05 $ 8.90 $ 7.11 $ 6.25 $ 5.08 $ 4.09 20
Financial ratios
21 Asset turnover 2 1.48 1.45 1.57 1.74
22 Return on sales
3 4.12% 3.78% 4.55% 5.82%
23 Return on average assets
4 6.03% 5.43% 6.92% 9.60%
24 Return on
average
shareholders’ equity
5
10.81% 9.61%
12.85%
17.65%
Comparative balance sheets (in millions)
25Totalcurrentassets 5.2 $ 9,967 $ 9,732 $ 9,190 $ 8,633 25 $ 8,273 $ 7,753 $ 6,842 $ 6,418 $ 5,333 $ 4,798 25
26 Cash and short-term investments 5.1 1,123 1,057 661 530
27 Merchandise inventory – net 4.6 8,321 8,249 8,209 7,611
28 Property, less accumulated depreciation 6.2 22,089 22,499 22,722 21,361
29 Total assets 6.5 33,699 33,005 32,625 30,816
30 Total current liabilities 5.5 7,119 7,355 7,560 7,316
31 Accounts payable 9.0 4,351 4,287 4,109 3,713
32Long-termdebt(excludingcurrentmaturities) 13.3 6,537 4,528 5,039 5,576 32 4,325 3,499 3,060 3,678 3,736 3,734 32
33 Total liabilities 8.6 15,587 13,936 14,570 14,718
34 Shareholders’ equity 4.8 $ 18,112 $ 19,069 $ 18,055 $ 16,098
35Equity/long-termdebt(excludingcurrentmaturities) 2.77 4.21 3.58 2.89 35 3.64 4.09 3.76 2.77 2.20 1.76 35
36 Year-end leverage factor: assets/equity 1.86 1.73 1.81 1.92
Shareholders, shares and book value
37 Shareholders of record, year-end 30,097 31,168 31,561 31,513
38 Shares outstanding, year-end (in millions) 1,354 1,459 1,470 1,458
39 Weighted-average shares, assuming dilution (in millions) 1,403 1,464 1,468 1,507
40Bookvaluepershare $ 13.38 $ 13.07 $ 12.28 $ 11.04 40 $ 10.31 $ 9.12 $ 7.43 $ 6.47 $ 5.26 $ 4.25 40
Stock price during calendar year (adjusted for stock splits)6
41High $ 28.54 $ 24.50 $ 28.49 $ 35.74 41 $ 34.83 $ 34.85 $ 30.27 $ 30.21 $ 25.00 $ 24.44 41
42Low $ 19.35 $ 13.00 $ 15.76 $ 21.01 42 $ 26.15 $ 25.36 $ 22.95 $ 16.69 $ 16.25 $ 12.40 42
43ClosingpriceDecember31 $ 25.08 $ 23.39 $ 21.52 $ 22.62 43 $ 31.15 $ 33.33 $ 28.80 $ 27.70 $ 18.75 $ 23.21 43
Price/earnings ratio
44 High 20 20 19 19
45 Low 14 11 11 11