Lowe's 2010 Annual Report Download - page 25
Download and view the complete annual report
Please find page 25 of the 2010 Lowe's annual report below. You can navigate through the pages in the report by either clicking on the pages listed below, or by using the keyword search tool below to find specific information within the annual report.-
 1
1 -
2
-
3
-
4
-
5
-
6
-
7
-
8
-
9
-
10
-
11
-
12
-
13
-
14
-
 15
15 -
 16
16 -
 17
17 -
 18
18 -
 19
19 -
 20
20 -
 21
21 -
 22
22 -
 23
23 -
 24
24 -
 25
25 -
 26
26 -
 27
27 -
 28
28 -
 29
29 -
 30
30 -
 31
31 -
 32
32 -
 33
33 -
 34
34 -
 35
35 -
36
-
37
-
38
-
39
-
40
-
41
-
42
-
43
-
44
-
45
-
46
-
47
-
48
-
49
-
50
-
51
-
52
-
53
-
54
-
55
-
56
-
57
-
58
 |
 |

LOWE’S 2010 ANNUAL REPORT 21
Income tax provision
Oureffectiveincometaxratewas37.7%in2010versus36.9%in2009.
Thelowereffectivetaxratein2009wasprimarilyduetocertainprior
yearfavorablestatetaxsettlements,whichdecreasedtheeffectivetax
ratebyapproximately70basispoints.
Fiscal 2009 Compared to Fiscal 2008
Net sales
Reectiveofthecontinuedchallengingsalesenvironment,netsales
decreased2.1%to$47.2billionin2009.Comparablestoresales
declined 6.7% in 2009 compared to a decline of 7.2% in 2008. Total
customer transactions increased 3.4% compared to 2008, driven by
ourstoreexpansionprogram.However,averageticketdecreased
5.4%to$61.66,primarilyasaresultoffewerprojectsales.Comparable
store customer transactions declined 1.0%, and comparable store
average ticket declined 5.7% compared to 2008.
Customers continued to focus on routine maintenance and repairs
insteadoflargerdiscretionaryprojectsduringscal2009.Weexperi-
enced solid sales performance in paint and nursery as a result of the
continued willingness of homeowners to take on smaller do-it-yourself
projects to maintain their homes and improve their outdoor space.
The paint category had positive comparable store sales performance
for each quarter during 2009. Appliances also performed better than
our average comparable store sales change, driven by attractive value
and customers’ willingness to invest in products that increase energy
efficiency. However, certain of our other categories, including home
fashion,cabinets&countertopsandmillwork,whicharemorediscre-
tionaryinnature,experienceddouble-digitdeclinesincomparable
storesalesfortheyear.Wealsoexperiencedcontinuedweakness
in other categories, including rough electrical, lumber and outdoor
powerequipment,whichalsoexperienceddouble-digitdeclinesin
comparable store sales driven by comparisons to hurricane-related
spending in 2008.
Due to consumers’ continued hesitancy to take on larger
discretionaryprojects,weexperiencedhigherthanaveragedeclines
within all specialty sales categories during 2009. Special Order Sales had
a 15.8% decline in comparable store sales, due to weakness in cabinets
&countertops,homefashion,lightingandmillwork.Comparablestore
Installed Sales declined 11.4% for 2009. However, both Special Order
SalesandInstalledSalesexperiencedsequentialimprovementinthe
third quarter of 2009, and positive comparable store sales in the
fourth quarter of 2009, as the economic pressures lessened. Sales
to Commercial Business Customers declined 9.1% in 2009, driven by
continued project delays within the remodel and repair businesses.
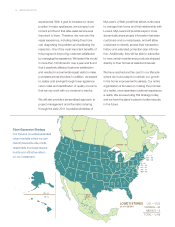
Fromageographicmarketperspective,weexperiencedcontinued
pressure from the declining housing market, with the most pronounced
declines in the Mid-Atlantic and Florida markets for the year. Many areas
were impacted by several years of housing pressure as well as the
financial markets. However, we saw evidence of broad-based stabiliza-
tion,asweexperiencedsequentialimprovementincomparablestore
sales for all 50 states from the third to the fourth quarter, and 26 states
had positive comparable results in the fourth quarter. For 2009, the
northeast and north-central markets performed above the Company
average, and for the fourth quarter of 2009 these areas delivered
positivecomparablestoresalesresults.Asaresult,weexperienced
a comparable store sales decline of 1.6% for the fourth quarter, compared
to a decline of 6.7% for the year.
Gross margin
For 2009, gross margin of 34.86% represented a 65 basis point increase
from2008.Marginrateimprovementcontributedapproximately
52 basis points of this increase, primarily driven by a moderating
promotional environment and decreased seasonal markdowns. The
seasonallivingcategoryexperiencedstrongmarginincreasescompared
to the prior year driven by reduced markdowns as a result of rational-
izingpurchaselevelsearlierintheyear.Theooringandlightingproduct
categoriesalsoexperiencedstrongimprovementcomparedtotheprior
year driven by the more rational promotional environment and our
decision to not repeat certain prior year promotions. In addition,
margin was positively impacted by lower inventory shrink, which
provided 12 basis points of leverage.
SG&A
TheincreaseinSG&Aasapercentageofsalesfrom2008to2009was
primarily driven by de-leverage of 61 basis points in store payroll. As
sales per store declined, an increased number of stores met the base
stafnghoursthreshold,whichincreasedtheproportionofxed-to-
totalpayroll.Wealsoexperiencedde-leverageofapproximately40basis
pointsinbonusexpenseattributabletohigherachievementagainst
performance targets in 2009. As a result of 2009 performance and
continuedexpansionrationalization,weexperienced20basispointsof
de-leverage associated with the write-off of new store projects that we are
no longer pursuing and long-lived asset impairment charges. Employee
insurance costs also de-leveraged 18 basis points as a result of rising
healthcareexpenses,higherenrollmentandhigheradministrativecosts.
In 2009, credit programs de-leveraged 16 basis points due to increases
in aged losses and bankruptcies as a result of higher unemployment
andcreditmarkettightening.Additionally,weexperiencedde-leverage
ofapproximately16basispointsinxedexpensessuchasproperty
taxes,utilitiesandrentduring2009asaresultofsalesdeclines.These
changes were offset slightly by leverage of 11 basis points related to
store opening costs associated with the opening of fewer stores in
2009 than in 2008.
Depreciation
Depreciation de-leveraged 23 basis points as a percentage of sales
in 2009. This de-leverage was driven by the comparable store sales
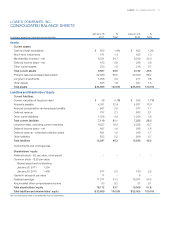
declines and the addition of 62 new stores in 2009. Property, less
accumulateddepreciation,decreasedto$22.5billionatJanuary29,
2010,comparedto$22.7billionatJanuary30,2009.AtJanuary29,
2010, and January 30, 2009, we owned 88% of our stores, which
included stores on leased land.
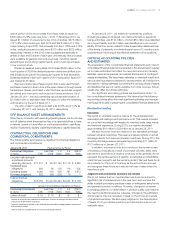
Interest
Netinterestexpenseiscomprisedofthefollowing:
(In millions) 2009 2008
Interestexpense,netofamountcapitalized $300 $314
Amortization of original issue discount and
loan costs 4 6
Interest income (17) (40)
Interest – net $287 $280
Netinterestexpenseincreasedprimarilyasaresultoflower
interest income due to lower interest rates and lower capitalized interest
associated with fewer stores under construction, partially offset by
lowerinterestassociatedwithfavorabletaxsettlementsduring2009.