Lowe's 2010 Annual Report Download - page 3
Download and view the complete annual report
Please find page 3 of the 2010 Lowe's annual report below. You can navigate through the pages in the report by either clicking on the pages listed below, or by using the keyword search tool below to find specific information within the annual report.-
 1
1 -
 2
2 -
 3
3 -
 4
4 -
 5
5 -
 6
6 -
 7
7 -
 8
8 -
 9
9 -
 10
10 -
 11
11 -
 12
12 -
 13
13 -
 14
14 -
15
-
16
-
17
-
18
-
19
-
20
-
21
-
22
-
23
-
24
-
25
-
26
-
27
-
28
-
29
-
30
-
31
-
32
-
33
-
34
-
35
-
36
-
37
-
38
-
39
-
40
-
41
-
42
-
43
-
44
-
45
-
46
-
47
-
48
-
49
-
50
-
51
-
52
-
53
-
54
-
55
-
56
-
57
-
58
 |
 |

In 2010, we generated solid earnings and cash flow as we grew our unit market share in 10 of 19 product
categories. We delivered on our brand promise by helping customers take advantage of government stimulus
programs like cash for appliances and energy tax credits. We also offered great values with national brands like
StainMaster® carpet and Valspar® paint, and with our private brands like allen + roth® home décor and Kobalt®
tools that offer exceptional style and function at a great price. Additionally, we provided strong credit offers
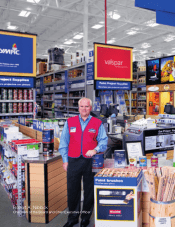
and affordable delivery and installation options. Further, we completed the roll-out of our District Commercial
Account Specialist (DCAS) and Project Specialist Exteriors (PSE) programs to more effectively reach customers
at their job site or home. Finally, while we further tempered our store expansion, we invested in new capabilities
that will help us generate more sales in our existing stores.
Looking forward, we expect customers will increase their spending as the cycle of declining home values ends
and as they become more confident in the employment outlook. But we can’t rely solely on the strengthening
economy. Strong employment growth and the bottom in home values are not expected until later in 2011.
We believe we can grow market share by focusing on the opportunity we have with existing customers – in other
words, garnering a greater share of wallet. Our research tells us customers are spending cautiously, stretching
out projects or buying only a few items instead of many, but they are still highly engaged in home improvement.
To win their business, we have to give them a sense of control, recognizing their personal needs and their desire
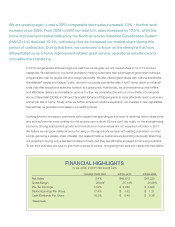
FINANCIAL HIGHLIGHTS
IN MILLIONS, EXCEPT PER SHARE DATA
CHANGE OVER 2009 FISCAL 2010 FISCAL 2009
Net Sales 3.4% $48,815 $47,220
Gross Margin 28 bps1 35.14% 34.86%
Pre-Tax Earnings 14.2% $ 3,228 $ 2,825
Diluted Earnings Per Share 17.4% $ 1.42 $ 1.21
Cash Dividends Per Share 18.3% $ 0.42 $ 0.36
1 Basis Points
We are growing again. Lowe’s 2010 comparable store sales increased 1.3% – the first such
increase since 2005. From 2005 to 2010 our total U.S. sales increased by 12.9%, while the
home improvement market defined by the North American Industrial Classification System
(NAICS) 444 declined 10.4%, indicating that we increased our market share during this
period of contraction. During that time, we continued to focus on the strengths that have
differentiated us as a home improvement retailer: great service, operational excellence and
innovative merchandising.