Lowe's 2010 Annual Report Download - page 43
Download and view the complete annual report
Please find page 43 of the 2010 Lowe's annual report below. You can navigate through the pages in the report by either clicking on the pages listed below, or by using the keyword search tool below to find specific information within the annual report.-
 1
1 -
2
-
3
-
4
-
5
-
6
-
7
-
8
-
9
-
10
-
11
-
12
-
13
-
14
-
15
-
16
-
17
-
18
-
19
-
20
-
21
-
22
-
23
-
24
-
25
-
26
-
27
-
28
-
29
-
30
-
31
-
32
-
 33
33 -
 34
34 -
 35
35 -
 36
36 -
 37
37 -
 38
38 -
 39
39 -
 40
40 -
 41
41 -
 42
42 -
 43
43 -
 44
44 -
 45
45 -
 46
46 -
 47
47 -
 48
48 -
 49
49 -
 50
50 -
 51
51 -
 52
52 -
 53
53 -
54
-
55
-
56
-
57
-
58
 |
 |

LOWE’S 2010 ANNUAL REPORT 39
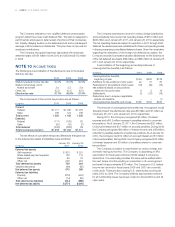
Fair Value Measurements – Non-Recurring Basis
January 28, 2011
Previous
Fair Value Carrying Impairment
(In millions) Measurements Amounts Losses
Operating stores:
Long-lived assets
held-for-use $15 $51 $(36)
Excessproperties:
Long-lived assets
held-for-use $45 $71 $(26)
Long-lived assets
held-for-sale $36 $44 $ (8)
January 29, 2010
Previous
Fair Value Carrying Impairment
(In millions) Measurements Amounts Losses
Operating stores:
Long-lived assets
held-for-use $6 $59 $(53)
Excessproperties:
Long-lived assets
held-for-use $74 $114 $(40)
Long-lived assets
held-for-sale $25 $46 $(21)
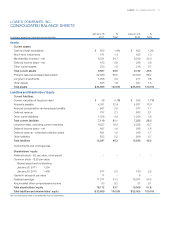
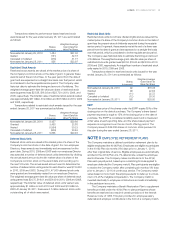
Fair Value of Financial Instruments
The Company’s financial instruments not measured at fair value on a
recurring basis include cash and cash equivalents, accounts receivable,
short-term borrowings, accounts payable, accrued liabilities and long-
termdebtandarereectedinthenancialstatementsatcost.Withthe
exceptionoflong-termdebt,costapproximatesfairvalueforthese
items due to their short-term nature. Estimated fair values for long-term
debt have been determined using available market information, including
reported trades, benchmark yields and broker-dealer quotes.
Carrying amounts and the related estimated fair value of the
Company’slong-termdebt,excludingcapitalizedleaseobligations,
are as follows:
January 28, 2011 January 29, 2010
Carrying Fair Carrying Fair
(In millions) Amount Value Amount Value
Long-term debt
(excludingcapitalized
leaseobligations) $6,209 $6,715 $4,737 $5,127
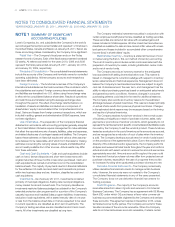
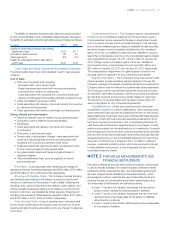
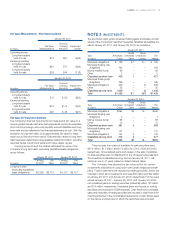
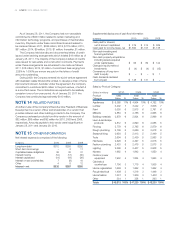
NOTE 3 INVESTMENTS
The amortized costs, gross unrealized holding gains and losses, and fair
values of the Company’s investment securities classified as available-for-
sale at January 28, 2011, and January 29, 2010, are as follows:
January 28, 2011
Gross Gross
Type Amortized Unrealized Unrealized Fair
(In millions) Costs Gains Losses Values
Municipalobligations $ 189 $1 $– $ 190
Municipaloatingrate
obligations 163 – – 163
Money market funds 66 – – 66
Other 2 – – 2
Classified as short-term 420 1 – 421
Municipaloatingrate
obligations 765 – – 765
Municipal obligations 209 – (1) 208
Other 35 – – 35
Classified as long-term 1,009 – (1) 1,008
Total $1,429 $ 1 $(1) $1,429
January 29, 2010
Gross Gross
Type Amortized Unrealized Unrealized Fair
(In millions) Costs Gains Losses Values
Municipalobligations $294 $2 $– $296
Municipaloatingrate
obligations 7 – – 7
Money market funds 68 – – 68
Other 12 – – 12
Classified as short-term 381 2 – 383
Municipaloatingrate
obligations 141 – – 141
Municipal obligations 134 2 – 136
Classified as long-term 275 2 – 277
Total $656 $4 $ – $660
The proceeds from sales of available-for-sale securities were
$814million,$1.2billionand$1.0billionfor2010,2009and2008,
respectively. Gross realized gains and losses on the sale of available-
for-sale securities were not significant for any of the periods presented.
The investments classified as long-term at January 28, 2011, will
mature in one to 41 years, based on stated maturity dates.
The Company has elected the fair value option for certain
investments maintained in conjunction with certain employee benefit
plans. These investments are reported as trading securities, which are
includedinshort-terminvestments,andwere$50millionand$42million
at January 28, 2011 and January 29, 2010, respectively. For the years
ended January 28, 2011, January 29, 2010, and January 30, 2009,
netunrealizedgainsfortradingsecuritiestotaled$6million,$7million,
and$14million,respectively.Unrealizedgainsandlossesontrading
securitieswereincludedinSG&Aexpense.Cashowsfrompurchases,
salesandmaturitiesoftradingsecuritiesareincludedincashowsfrom
investingactivitiesintheconsolidatedstatementsofcashowsbased
on the nature and purpose for which the securities were acquired.